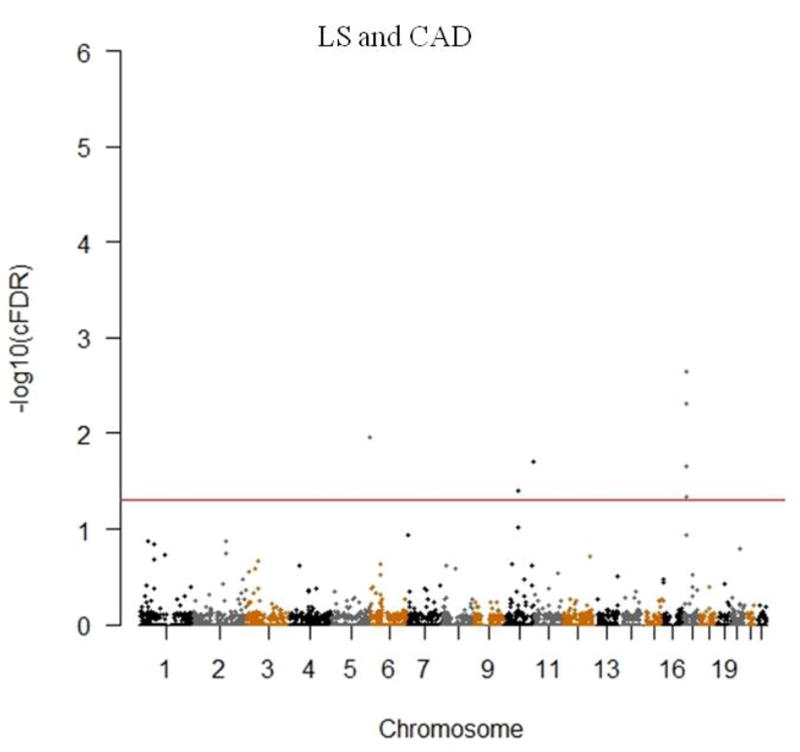
Figure 2.
Conjunction Manhattan plot of conjunction –log10 FDR values for LS BMD and CAD. The red line marking the conditional –log10 FDR value of 1.3 corresponds to a ccFDR < 0.05. The figure shows the genomic locations of pleiotropic SNPs and further details are presented in Table 1.

