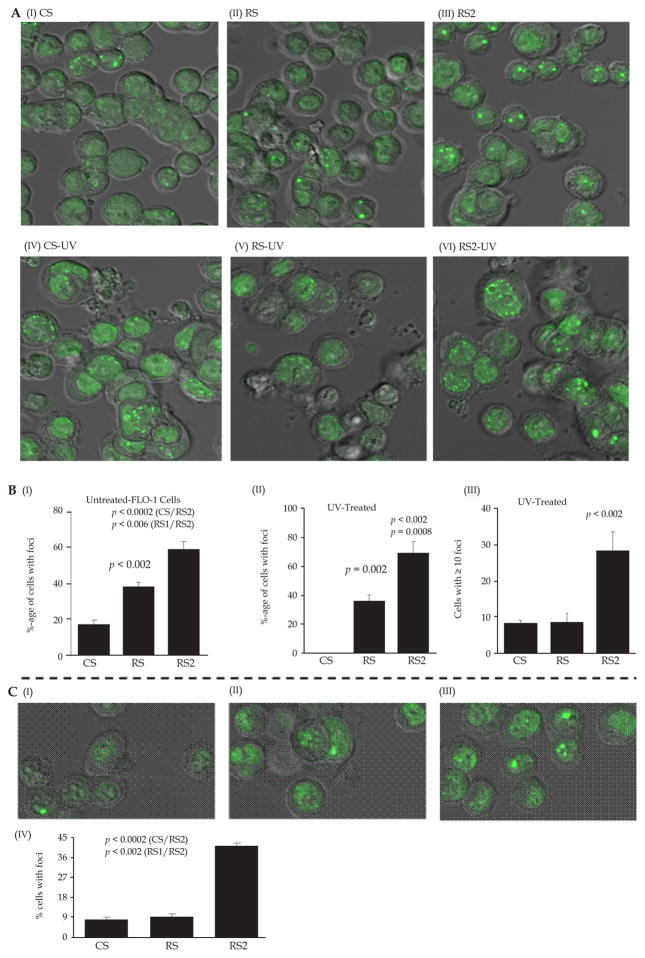
Figure 3. Impact of RAD51 amount on 53BP1 in BAC cells.
FLO-1 cells were treated either with control shRNA (CS) or RAD51-targeting (RS, RS2, shRNAs) described in Figure 2 and following selection, cells evaluated for impact on DNA breaks by by investigating levels of 53BP1. (A) Images of immunofluorescence showing impact of these treatments under spontaneous condition (I–III) and following exposure to UV (IV–VI) are shown. (B) Bar graphs showing percentage of cells with any number of foci (I–II) or those with ≥ 10 foci (III) are shown. (C) Impact of RAD51 amount on 53BP1 in OE33 cells treated as described in Panel A. Images of immunofluorescence (I–III) Bar graphs showing percentage of cells with any number of foci (IV) are shown.

