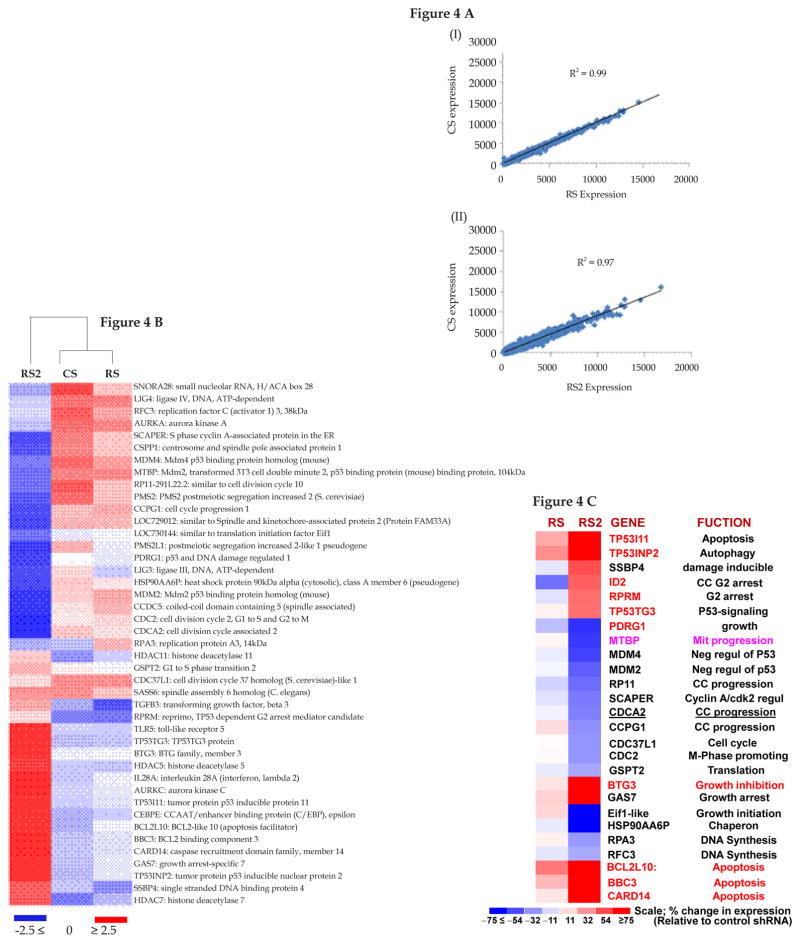
Figure 4. Impact of strong vs. moderate suppression of RAD51 on expression profile in BAC cells.
(A) FLO-1 cells were transduced with lentiviruses, expressing control shRNA (CS) or those inhibiting RAD51 expression, either moderately (RS) or strongly (RS2). Following recovery and selection in puromycin, the cells were evaluated for impact on expression profile, using Human Gene 1.0 ST Arrays. (A) Regression plots show that global gene expression patterns of RS (panel I) and RS2 (panel II) were similar to CS. (B) Cluster analysis using a subset of DNA damage and repair genes shows that CS and RS cluster together, whereas RS2 shows variation. (C) Expression of selected growth and apoptosis related genes in RS and RS2 cells. The color scale at the bottom of the figure represents fold change in expression, relative to control (CS) cells.

