Fig. 1.

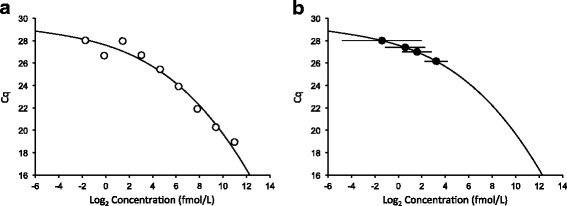
Examples of graphs aiding LLOQ determinations based on logistic modeling. a 3-parameter logistic model fit of calibration curve data. b Inverse predictions with 95% confidence intervals for sample data

Examples of graphs aiding LLOQ determinations based on logistic modeling. a 3-parameter logistic model fit of calibration curve data. b Inverse predictions with 95% confidence intervals for sample data