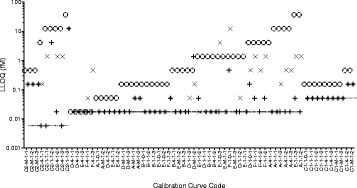
Fig. 5.

LLOQ determinations from two workflows for a multi-site set of miR-1 calibration curves. The lowest calibrator concentration in each standard curve (5.7 amol/L, 16.9 amol/L, or 50.8 amol/L) is indicated by the dashed line. LLOQs were calculated by the baseline noise workflow (O) or the logistic model workflow using the relative error option (+) or the standard error option (X). The calibration curve code conveys the presence of differences in site, assay multiplicity, and round among the dataset
