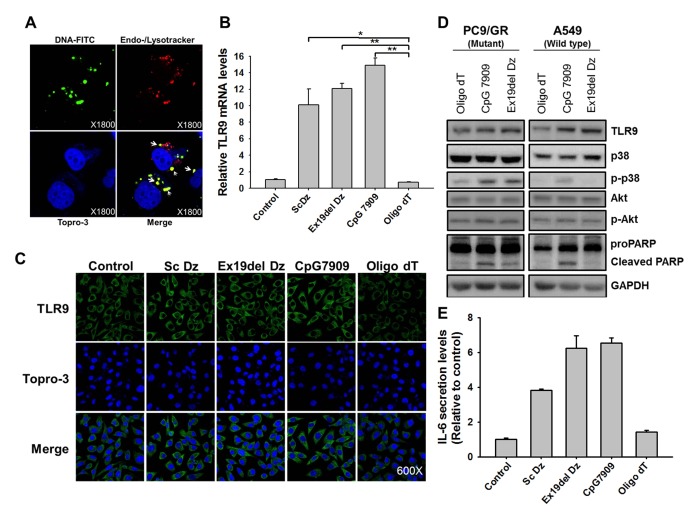
Fig. 4.
CpG-DNAzyme induces an increase in TLR9 expression and subsequent p38 MAPK activation. (A) FITC-labeled Ex19del Dz (100 nM, green fluorescence) was transfected into lung cancer cells for 6 h, and the cells were fixed in 4% paraformaldehyde and imaged under a fluorescence confocal microscope. After fixation, endosomes and lysosomes were stained with Endo-/Lyso tracker dye (red fluorescence). Nuclei were stained with TOPRO-3 (blue fluorescence). Merged images indicate the co-localization of FITC-labeled DNAzyme and endosomes/lysosomes, as shown in yellow-colored fluorescence (indicated with arrows). (B) Oligo DNAs (100 nM) were transfected into PC9/GR lung cancer cells (5 × 10⁵ cells). At 48 h after transfection, total RNAs were obtained for analysis. Real-time PCR for the detection of TLR9 cDNA was performed in oligo DNA-transfected cells, as described in the graph. cDNA amplified from TLR9 transcripts was relatively quantified by normalization to control cells that were untreated. *P < 0.01 and **P < 0.005 vs. the oligo dT group. (C) Confocal microscopic images of PC9/GR and HepG2 cells that were transfected with 100 nM individual oligo DNA as indicated. At 48 h after transfection, cells were fixed in 4% paraformaldehyde and incubated with primary antibody against TLR9. After 12 h of incubation, goat anti-rabbit IgG with fluorophore was used as the secondary antibody (green fluorescence). Nuclei were counterstained using TOPRO-3. (D) Oligo DNAs (100 nM) were transfected into lung cancer cells (PC9/GR and A549) for 6 h. After 24 h of incubation, total cellular proteins (30 μg) were obtained and resolved by 10% SDS-PAGE. In addition to probing PARP cleavage, TLR9, Akt, p38, and their phosphorylated forms were probed by western blot analysis. (E) Oligo DNAs (100 nM) were transfected into lung cancer cells (PC9/GR) for 24 h. Cell culture supernatants were harvested and 100 μl of supernatants was used for ELISA to detect IL-6. Bar graphs show the mean ± S.D. of three independent experiments, and the values were normalized to those of the non-treated control.

