
Extended Data Figure 6. Astrocytic NLs controls astrocyte morphogenesis in vivo.
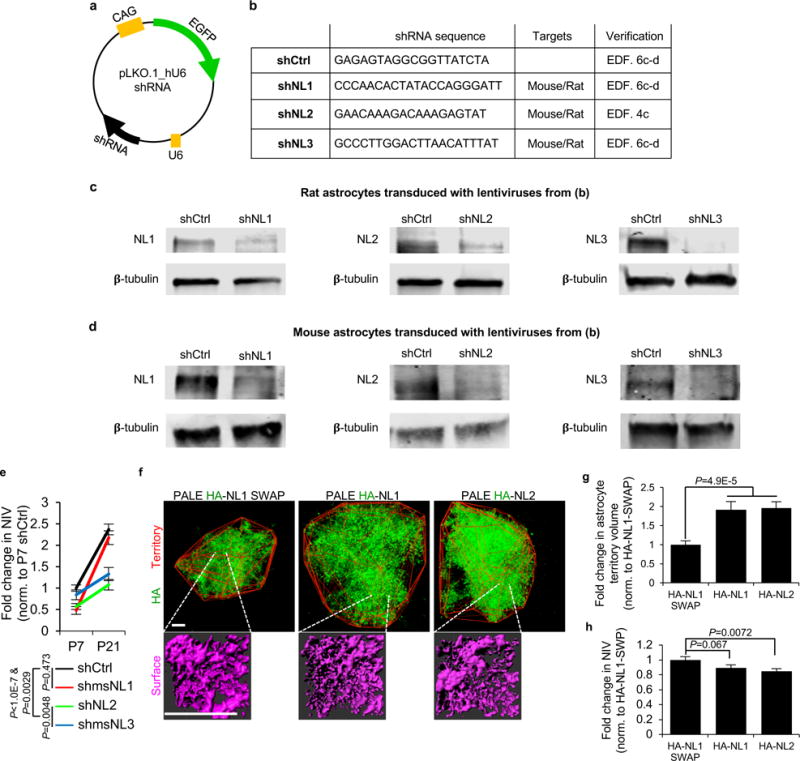
a-d, Verification of shRNAs used in vivo. a, Schematic of pLKO.1_hU6 plasmid vector housing the shRNA sequence and EGFP-reporter. shRNA constructs targeting both mouse and rat NL1 and NL3 transcripts were obtained from Dharmacon. shNL2 used was in42,43 which effectively silences both mouse and rat NL2. In this plasmid backbone, the shRNA expression is driven from the human U6 minimal promoter. The commercially available plasmids do not encode for a fluorescent protein reporter; therefore, we cloned EGFP under the control of a CAG promoter (see methods and materials for details). b, shRNA sequences used to silence mouse NLs for PALE. Due to perfect match with the rat sequences, the same shRNAs also target rat NLs. shNL1 and shNL3 targeting vectors were verified here. shNL2 was verified in this study (see Extended Data Fig. 4c) and by42,43. c-d, Western blot analysis of lysates from cultured rat (c) or mouse (d) astrocytes transduced with lentiviruses expressing shCtrl or shNLs. The shNLs effectively silenced the expression of endogenous NL1 (left), NL2 (middle) and NL3 (right) both in rat and mouse astrocytes. β-tubulin levels are shown as a loading control. Blots represent 1 experiment. Similar results were obtained from 3 separate experiments. e-h, Astrocytic NLs control astrocyte morphogenesis in vivo. e, Data from Fig. 3e and Fig. 3f normalized to P7 shCtrl astrocyte NIV values and replotted to determine how NL silencing affects the growth trajectory of astrocyte NIV. shNL2 and shNL3-transfected astrocytes failed to expand their neuropil infiltration from P7 to P21, whereas shCtrl and shNL1-transfected astrocytes displayed a robust (~2.5 fold) growth. 3 NIV/cell, 10-20 cells/condition, at least 3 mice/condition. f, (Top) Representative images of P21 NL-over expressing PALE astrocytes from L4-5 V1 cortex. The territories of the NL over-expressing PALE astrocytes were determined in Imaris Bitplane software with a Matlab Xtension. This method identifies the terminal fluorescent points of each astrocyte and connects these points to generate the territory of each cell (red outline). (Bottom) Representative NIV (magenta) for NL over-expressing PALE astrocytes. g, Fold change in average territory volume of NL1 or NL2 over-expressing PALE astrocytes normalized to HA-NL1-SWAP. In the brains from three cohorts of 7 PALE NL3 over-expressing mice, we were unable to find NL3-overexpressing astrocytes at P21, indicating that NL3-overexpression starting at P1 is not compatible with astrocyte survival and/or maturation. h, Fold change in average NIV of NL over-expressing PALE astrocytes normalized to HA-NL1-SWAP. Astrocytes might already occupy the available neuropil space; thus, NL over-expression primarily forces astrocyte to expand. Alternatively, each NL might direct astrocyte processes to certain neuronal elements; thus, NL over-expression drives the astrocyte towards such structures, expanding their domains. g-h, 3 NIV/cell (h only), 14-20 cells/condition, 4 mice/condition. ANCOVA (e), one-way ANOVA (g, h). For gel source data, see Supplementary Figure 1. Data are means ± s.e.m. Scale bars, 10 μm.