
Extended Data Figure 7. NL2 protein is expressed in astrocytes and is required for neuropil infiltration in vivo.
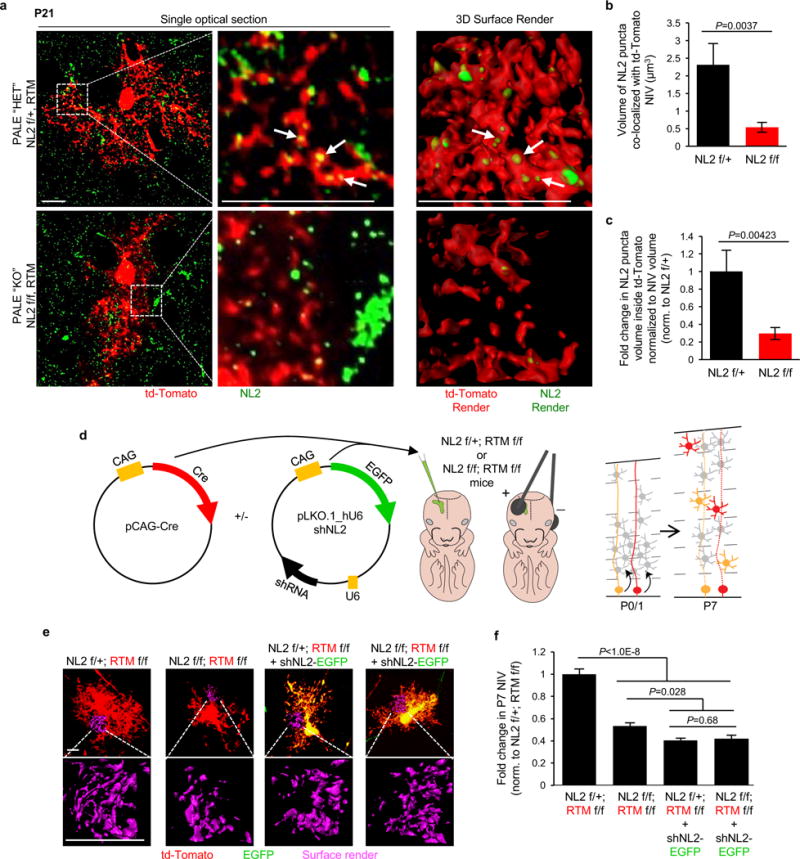
a-c, NL2 protein staining in NL2 PALE HET and KO astrocytes. a, Representative high magnification Airyscan confocal images of P21 td-Tomato/Cre+ PALE astrocytes from NL2 HET f/+ (top) and NL2 KO f/f (bottom) mice immunostained using an antibody against the intracellular domain of NL2. (Left) Single optical section of the td-Tomato/Cre+ astrocytes depicting NL2 staining (green) and td-Tomato/Cre+ astrocyte (red). (Middle) Zoomed-in single optical section blow up of boxed region from left. (Right) Representative Imaris 3D reconstructed surface renderings of the co-localized NL2 (green) and td-Tomato/Cre+ (red) signals in NL2 HET f/+ and NL2 KO f/f astrocytes (NL2 signal outside of the td-Tomato/Cre+ cell is not surface rendered). b, Quantification of average NL2 puncta volume inside td-Tomato/Cre+ NIV of PALE NL2 HET f/+ and NL2 KO f/f astrocytes. c, Fold change of NL2 puncta volume per td-Tomato/Cre+ volume, normalized to NL2 HET f/+. b-c, 2 NIV/image, 3 cells/mouse, 3 mice/genotype. d-f, shNL2 has no off-target effects in astrocytes in vivo. d, Approach to test the specificity of shNL2 in vivo. pCAG-Cre plasmid was injected with or without the shNL2 plasmid into P1 NL2 f/+ or NL2 f/f pups that also contained two copies of the RTM reporter. Animals were sacrificed at P7 for astrocyte morphological analysis. e, Representative images of P7 td-Tomato/Cre+ astrocytes (red) or co-expressing shNL2 (green and red, appears as yellow) from PALE NL2 HET f/+ and NL2 KO f/f mice. Representative NIV are shown below each astrocyte (magenta). f, Fold change in average NIV of P7 td-Tomato/Cre+ PALE NL2 HET f/+ and NL2 KO f/f astrocytes with or without shNL2, normalized to td-Tomato/Cre+ PALE NL2 f/+. 3 NIV/cell, 16 cells/conditions, at least 2 mice/genotype. one-tailed t-test (b-c), one-way ANOVA (f). Data are means ± s.e.m. Scale bars, 10 μm.