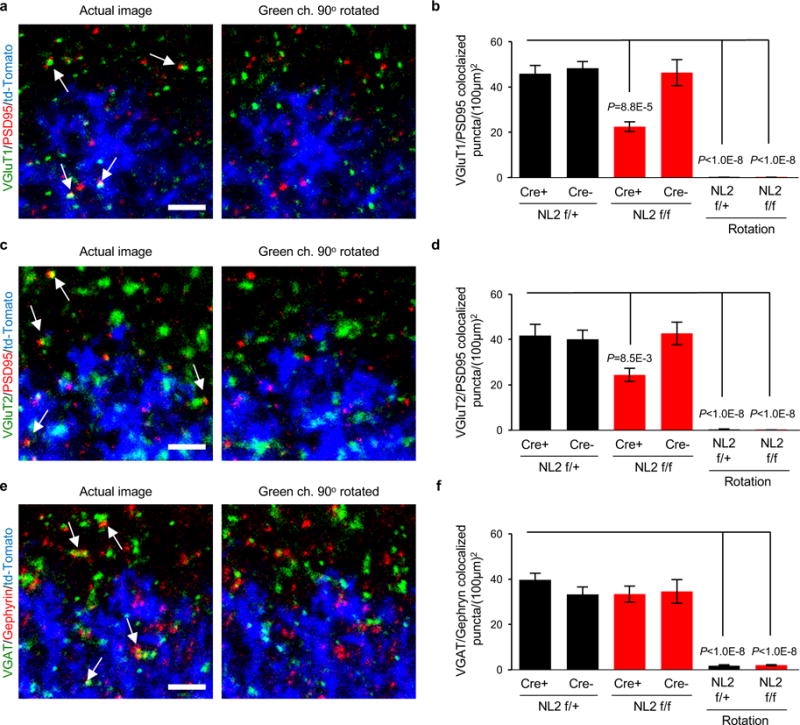
Extended Data Figure 8. Controls determining the specificity of synaptic immunohistochemistry.

a-f, To test if synaptic immunostaining reflects true protein localization or random signal, a rotation analysis was performed as previously described in42. In this test, the presynaptic channel was rotated 90° respective of the other two channels and re-merged to create a rotated image. Synapse density quantifications were re-run using the rotated image compared to the standard image. a, c, e, Representative images of standard and rotated images stained for excitatory VGluT1 (red)/PSD95 (green) (a), excitatory VGluT2 (red)/PSD95 (green) (c), and inhibitory VGAT (red)/Gephyrin (green) (e) synaptic staining. Images depict the territory boundary of td-Tomato/Cre+ (blue) astrocytes and td-Tomato/Cre- WT (unlabeled) astrocytes. b, d, f, Quantification of co-localized synaptic puncta density of standard and rotated images from excitatory VGluT1/PSD95, excitatory VGluT2 (red)/PSD95 (green) (c), and inhibitory VGAT (red)/Gephyrin (green) (e) synaptic staining. Standard images (left 4 bars) compared to the rotated images (right 2 bars). One-way ANOVA (b, d, f). Data are means ± s.e.m. Scale bar, 2 μm.
