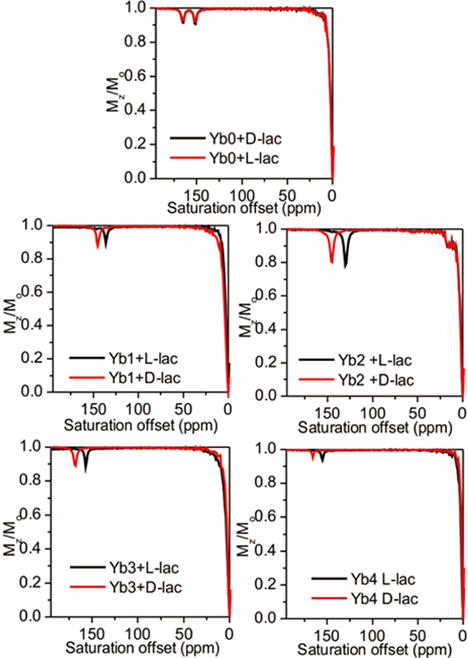
Figure 6.

CEST spectra of Yb(III)-complexes with either L-lactate or D-lactate in H2O. (50 mM complex with 50 mM D-lactate or L-lactate). Presaturation pulse of 4 s with B1 of 14.1 μT was applied at 298 K using a 9.4 T NMR spectrometer. The pH was adjusted to 7.4 in all samples just prior to data collection. CEST spectra were only shown the downfield part for clarification.
