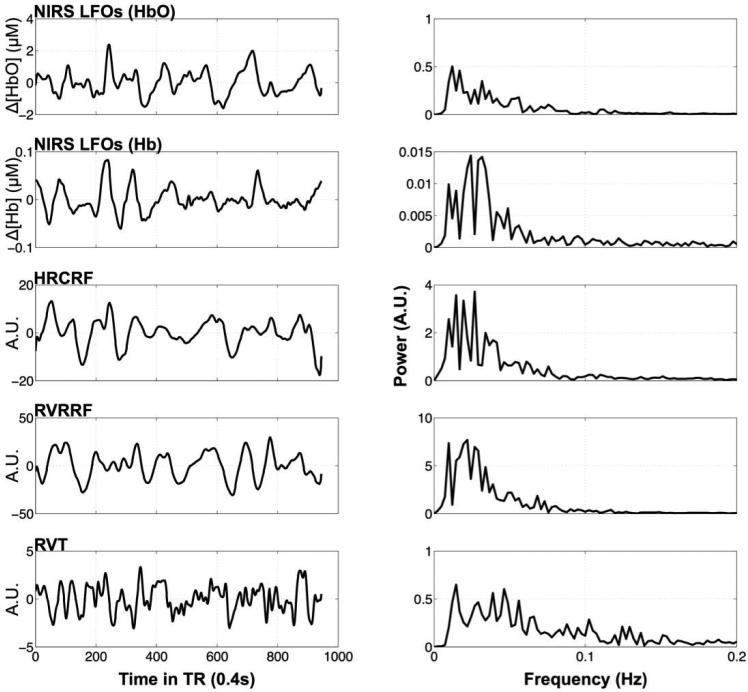
Figure 2. Example timecourses and their frequency distributions.
Timecourses (first column) of one participant downsampled to the TR of 0.4 s and their frequency distributions (second column) are depicted for each method (row) in the following order: NIRS Δ[HbO] and Δ[Hb] LFOs, the cardiac variation method, HRCRF, and the two respiration variation methods RVRRF and RVT.

