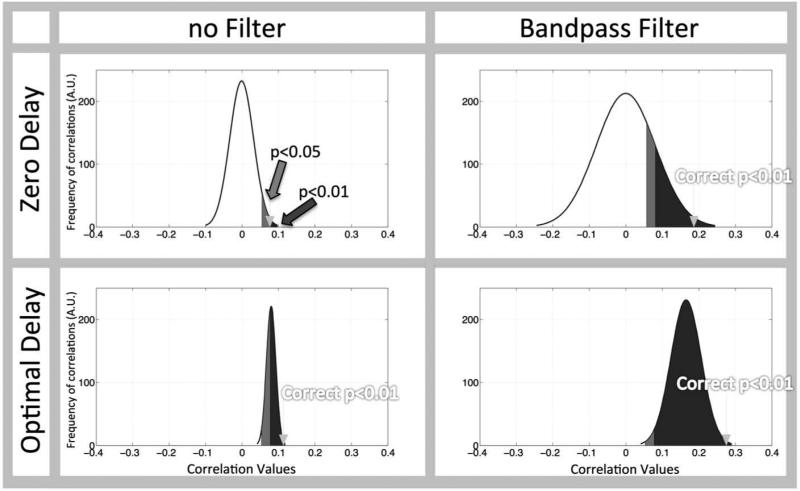
Figure 3. Standard statistical methods to evaluate correlations with bandpass filtering and optimal delayed signals are suboptimal.
Two completely random signals, resampled to 2.5 Hz (0.4 s) were generated over 1000 trials. The effects of bandpass filtering (0.01-0.2 Hz) as well as applying the optimal delay are shown as a distribution curve of the actual correlation between these completely random signals for each case (the black curve shows the smoothed histogram). “Significant” outcomes, when standard statistical methods are used, are shown for a one-sided alpha=0.05 (light grey shaded area) and alpha of 0.01 (dark grey shaded area) are shown. The correct threshold for the correlation distributions with an alpha=0.01 is marked with an arrow. The panel showing ‘Zero Delay’ and ‘no Filter’ is the only case in which the thresholds found with the conventional statistical methods and those found from the actual correlation distribution agree (the arrow and the dark shaded area).

