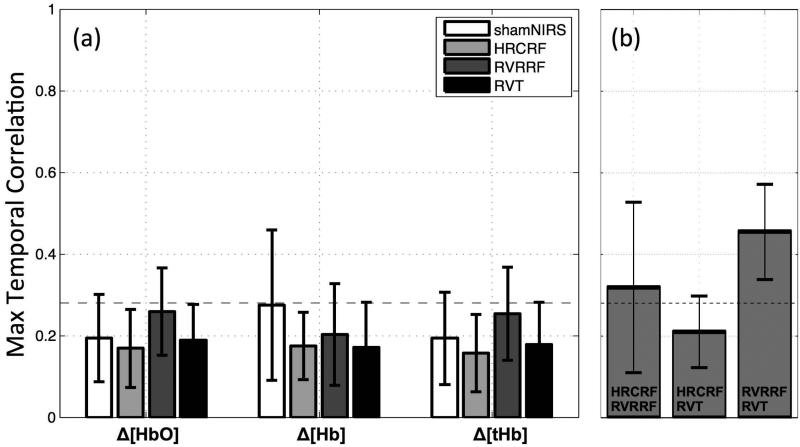
Figure 4. NIRS LFOs contain distinct temporal information.
(a) The mean maximal temporal correlation coefficients within subjects (r) between the NIRS LFO signal and the LFOs modeled by three other physiological BOLD denoising methods (grey shades) as well as the sham correlation (NIRS timecourse shifted 700 s in time correlated with the correctly aligned NIRS timecourse, white squares, error bars represent standard deviations). Significant correlations (P<0.01, one sided independent sample t-test) were not found. The dotted horizontal line was drawn for the upper limit of the confidence interval of random correlations (rt=0.28) at alpha=0.01. (b) The mean maximal temporal correlation coefficients (r) between the LFOs models HRCRF, RVRRF and RVT. The dotted horizontal line was drawn for the upper limit of the confidence interval of random correlations (rt=0.28) at alpha=0.01.

