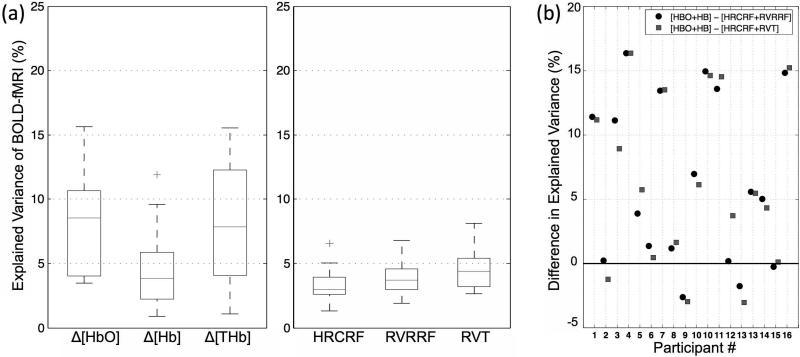
Figure 7. NIRS LFOs contain information highly correlated with BOLD fMRI.
(a) BOLD fMRI variance explained by the LFO methods in the grey matter as boxplots from left to right: NIRS Δ[HbO], Δ[Hb] and Δ[tHB] LFOs, the cardiac variation method HRCRF, and the two respiration variation methods RVRRF and RVT. The median is indicated with a horizontal line in the boxplots, and the outlier by a ‘+’. (b) Difference in explained BOLD fMRI variance between NIRS Δ[HbO] and Δ[Hb] (HBO+HB) combined and the respiration and cardiac variation models combined (HRCRF+RVRRF and HRCRF+RVT) per participant. The respiration and cardiac based models combined explained variance (%) was subtracted from the NIRS LFOs. Positive values indicate that the NIRS LFOs performed better and negative values indicate that respiration and cardiac based models performed better.

