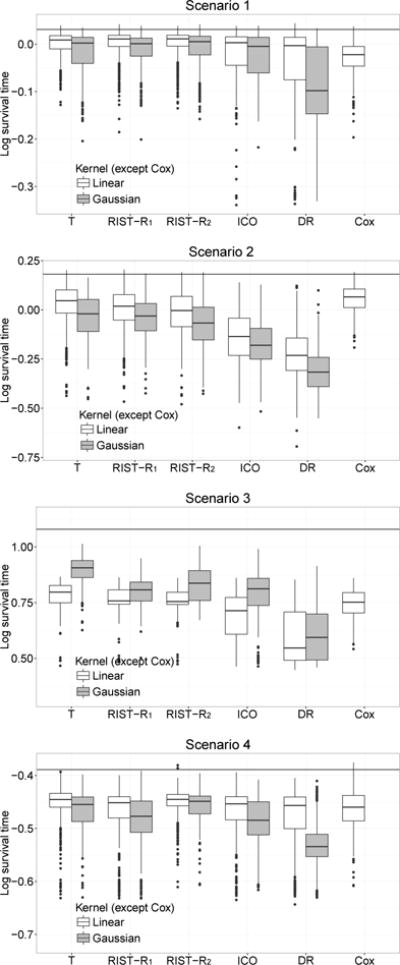
Fig 1.

Boxplots of mean log survival time for different treatment regimes. Censoring rate: 45%. T: using true survival time as weight; RIST-R1 and RIST-R2: using the estimated R1 and R2 respectively as weights, while the conditional expectations are estimated using recursively imputed survival trees; ICO: inverse probability of censoring weighted learning; DR: doubly robust outcome weighted learning. The black horizontal line is the theoretical optimal value.
