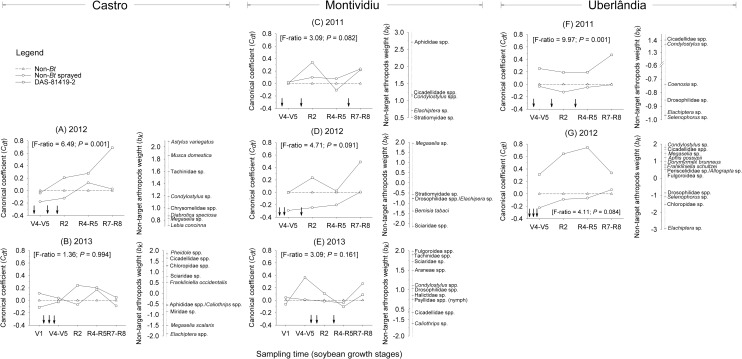
Fig 1. Principal Response Curves (PRC) indicating the effect of non-Bt soybean with insecticides sprayed and Bt soybean (DAS-81419-2) on the most representative non-target arthropods collected by Moericke traps (yellow pan) at three sites over two to three years in Brazil.
Dotted line indicates the community response to the control treatment (non-Bt without insecticides). The non-target arthropods weight (bk) can be interpreted as the affinity of the taxon with the Principal Response Curves (Cdt). Only taxa with bk values greater than 0.5 and less than -0.5 are shown in the diagram. Following Monte Carlo permutation tests, P-values less than 0.05 indicate a statistically significant difference in community response between at least one of the treatments and the control. Down arrows (↓) indicate the time of insecticide application in the sprayed non-Bt treatment.

