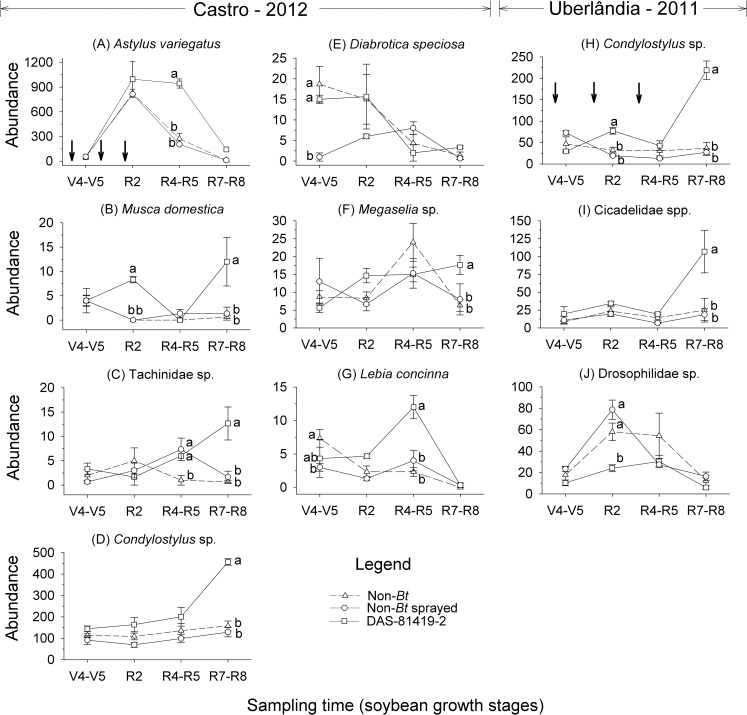
Fig 2. Population dynamics for non-target arthropod groups collected by Moericke traps (yellow pan) in non-Bt (with and without insecticides) and Bt (DAS-81419-2) soybean fields.
Means (± SE) within sampling time followed by different letters are significantly different (Tukey’s test, α = 0.05). Taxa shown include those with taxon weights greater than 0.5 and less -0.5 which were associated with statistically significant Monte Carlo tests. Down arrows (↓) indicate the time of insecticide application in the sprayed non-Bt treatment.

