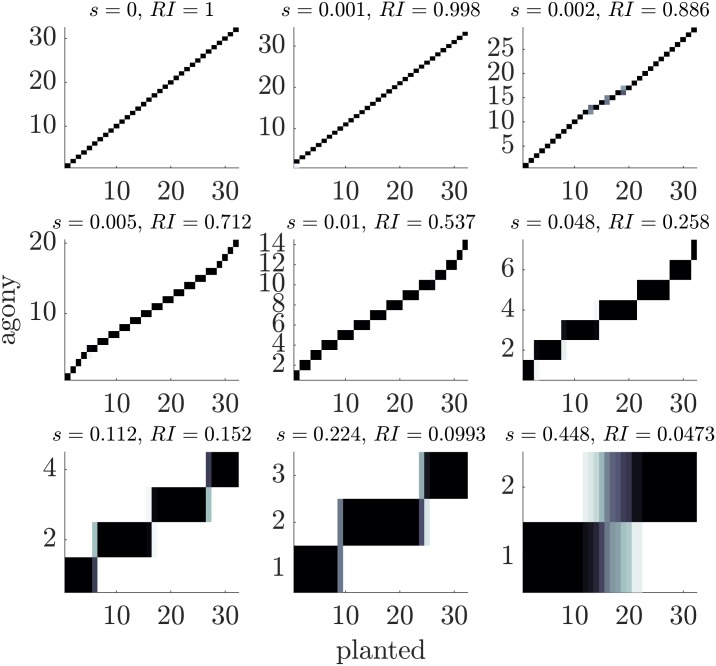
Fig 5. Heat maps comparing the planted ranking with the ranking inferred with agony for twitter-like hierarchy.
In each panel a square in position (i, j) contains the number of nodes that belong to class i in the planted rank and are placed in class j by agony: the darker the colour, the higher the number. The parameters are p = q = 0.5, R = 32 and 9 values of s. Each plot refers to a single realisation from the ensemble.

