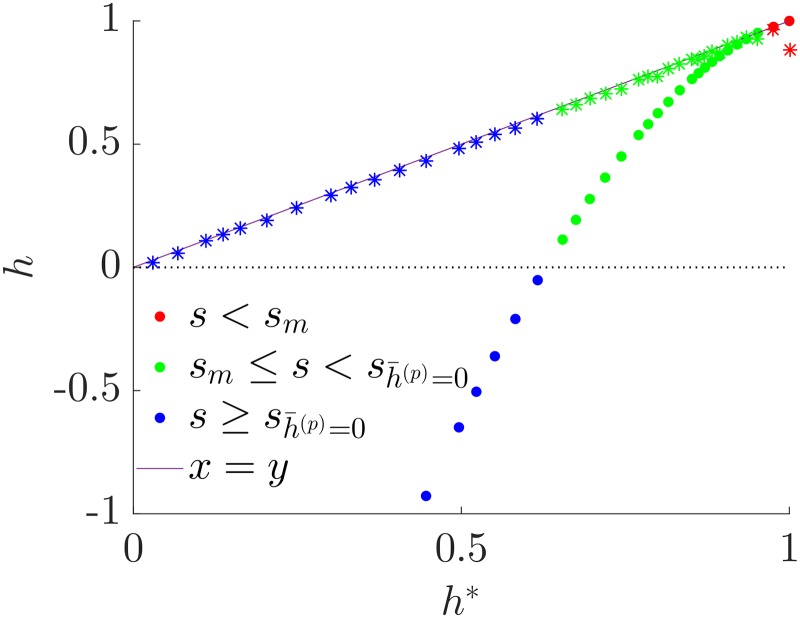
Fig 6. Comparison of hierarchies for twitter-like RSBMs.
The parameters are p = q = 0.5, R = 32, s varies in [0, smax], with smax = 0.448. Each point refers to a single realisation of the ensemble. The circles represent the pairs , i.e. the optimal hierarchy computed with agony and the one of the planted hierarchy . The stars represent where is the theoretical hierarchy of Eq (8) with the parameters of the SBM estimated via GraphTool. Finally, sm is the theoretical resolution threshold and is the theoretical value of s for which the estimate for the planted hierarchy is zero.

