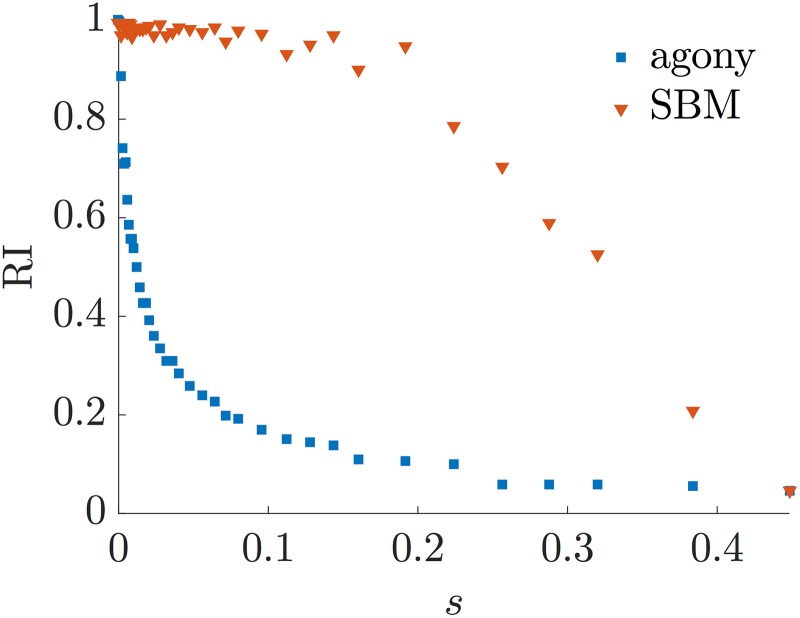
Fig 7. The figure shows the value of the Rand Index between the planted ranking and the inferred ones.
The blue squares considers the ranking obtained with agony (hence d = 1), while the red triangles considers the ranking obtained with a RSBM fit via GraphTool. The parameters of the twitter-like hierarchy are p = q = 0.5, R = 32, s varies in [0, smax], with smax = 0.448, and each point refers to a single realisation of the ensemble.

