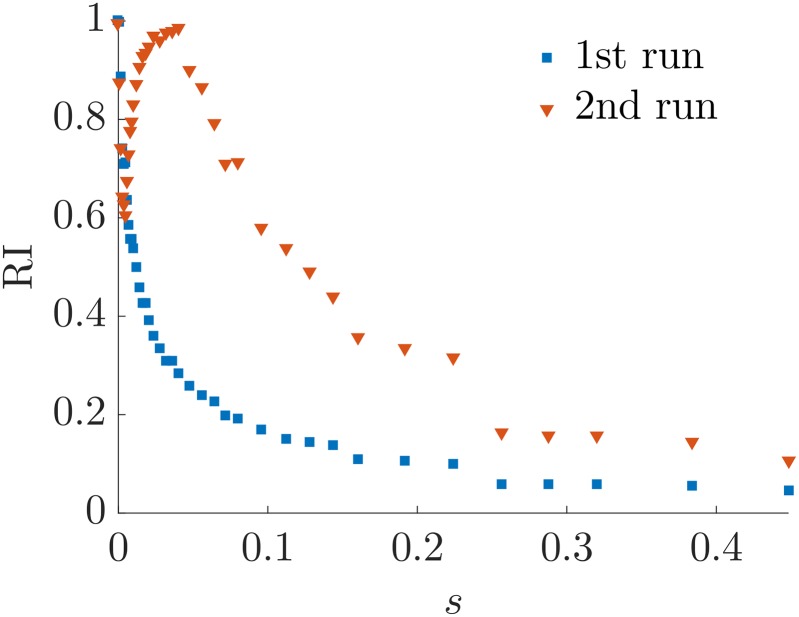
Fig 10. Comparison of the Rand Index between the planted ranking and one (blue squares) or two (orange triangles) iterations of agony.
Data refers to simulation of twitter-like HSBM with parameters p = q = 0.5, R = 32, s ∈ [0, smax], with smax = 0.448, and each point refers to a single realisation of the ensemble.

