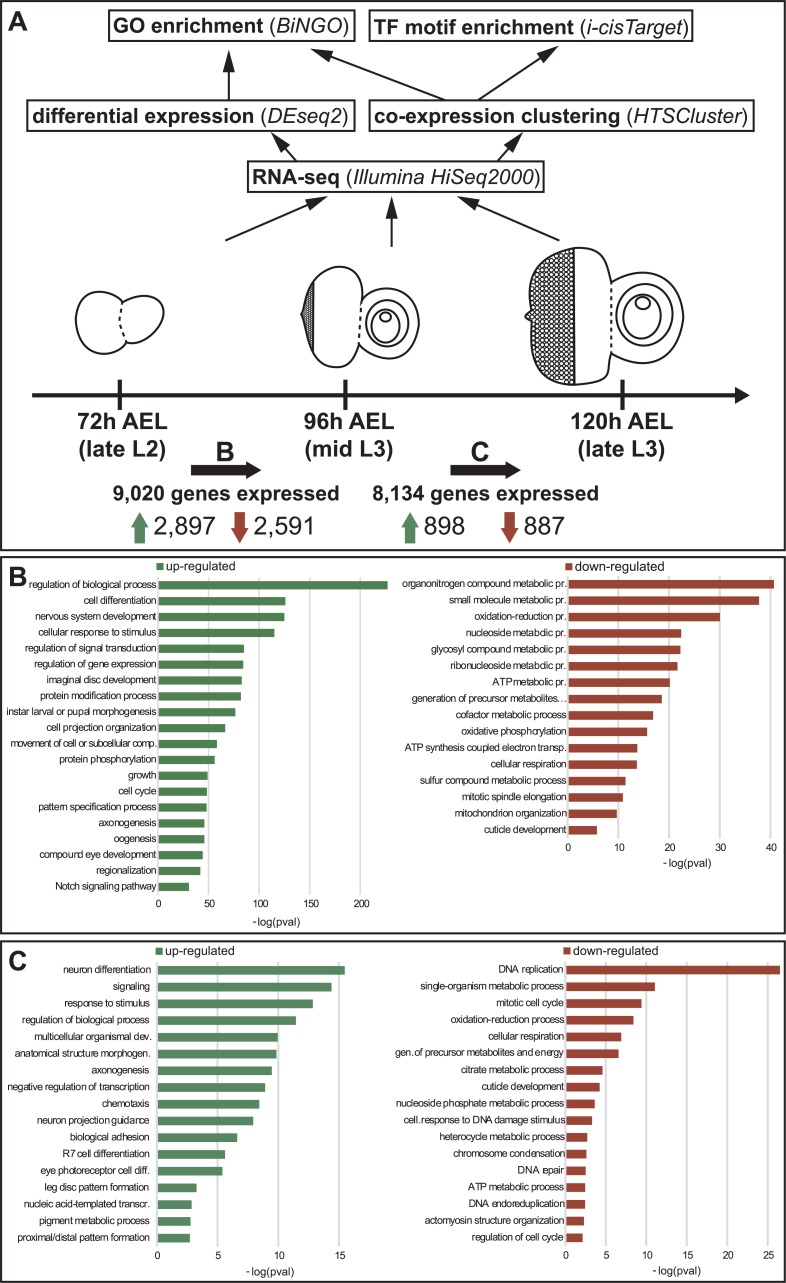
Fig 1. Analysis pipeline and expression dynamics at stage transitions.
(A) The mRNA of eye-antennal imaginal discs was sequenced at three developmental stages: late L2, mid L3 and late L3. Upwards arrows illustrate the applied analysis pipeline. The total number of expressed genes for each stage transition is shown below the imaginal discs (B: late L2 to mid L3; C: mid L3 to late L3). The numbers next to the green arrows represent upregulated genes in each transition and the numbers next to the red arrow represent downregulated genes. (B) GO term enriched in the upregulated (green, left) and downregulated (red, right) genes in the transition from late L2 to mid L3 stage. (C) GO terms enriched in the upregulated (green, left) and downregulated (red, right) genes in the transition from mid L3 to late L3 stage.

