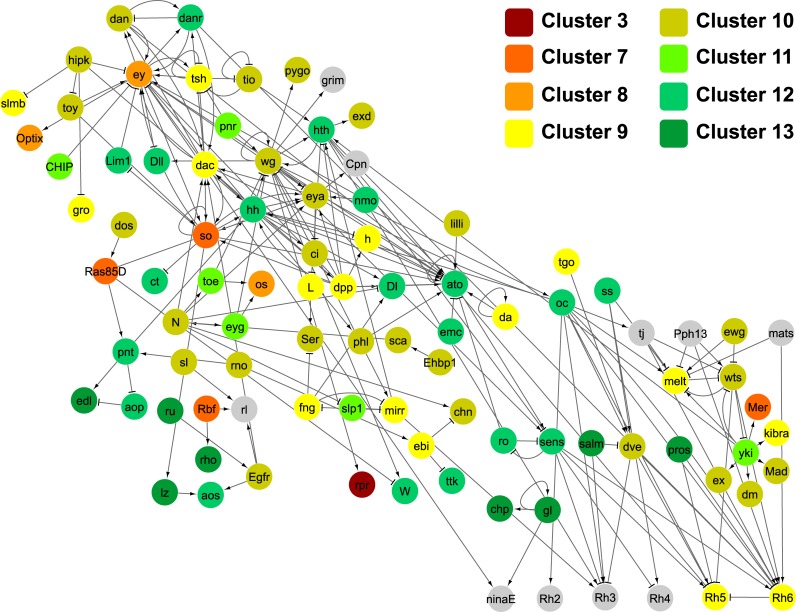
Fig 3. Assignment of key retinal genes to identified co-expression clusters.
Directed gene interaction network (FlyOde,[50]) of the genes known to be involved in retinal development in D. melanogaster. Only genetic and protein-DNA interactions are included. The horizontal axis represents developmental time, with early L3 at the most left, and the vertical axis displays network hierarchy (please see [50] for details). Each node represents a gene, and these are color-coded according to the assigned co-expression cluster (see also Fig 2). In grey are genes that have not been allocated to any cluster, either because they did not pass the expression level threshold or the clustering confidence threshold (see Materials and Methods for details).

