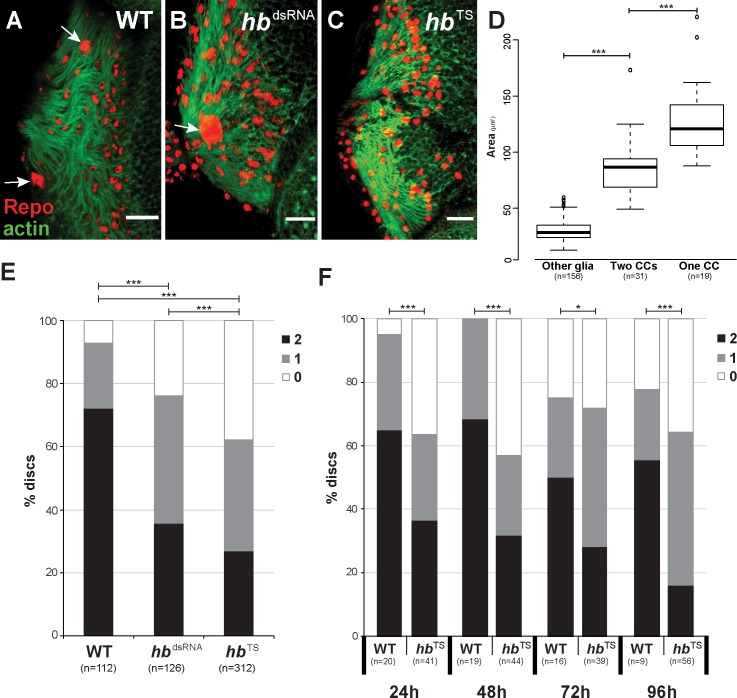
Fig 5. The number of polyploid glia cell nuclei is reduced after loss of Hb function.
(A-C) Staining with rabbit α-Repo antibody (red) and Phalloidin (green) of late L3 eye-antennal discs in wild type (A), repo driven hb RNAi (B) and Hb temperature sensitive mutant (C). This figure represents the phenotypes that were analyzed in (D), where the number of polyploid nuclei (white arrows) have been quantified. In all pictures, anterior is to the right. Scale bar = 20 μm. (D) Box plot of glia cell nuclei size. When two carpet cells were present, these are significantly larger than other surrounding glia cells. When only one carpet cell was present in the retinal field, its nucleus was significantly larger than regular carpet cells. Significance calculated by t-test (“Two CCs” vs. “One CC”, homogeneous distribution of variances) and t-Welch-test (“Other glia” vs. “Two CCs”, not homogeneous distribution of variances); “***”: p < 0.0005. (E) Quantification of the number of polyploid nuclei observed in wild type (WT), repo-Gal4 and moody-Gal4 driven UAS-hb RNAi (hbdsRNA) and Hb temperature sensitive mutant (hbTS). (F) Quantification of the number of polyploid nuclei observed in late L3 eye-antennal discs of flies that were raised at 18°C until the indicated time points (24h AEL, 48h AEL, 72h AEL and 96h AEL), when they were transferred to the restrictive temperature of 28°C. In D and E, the black bar indicates percentage of discs with two polyploid glia cell nuclei, grey indicates discs with one polyploid glia cell nucleus and white indicates discs without polyploid glia cell nuclei. Pearson’s Chi-squared test was performed to determine if the distribution of the different number of cells (0, 1 or 2) was equal between wild type and RNAi. *: p-val < 0.05, ***: p-val < 0.0005.

