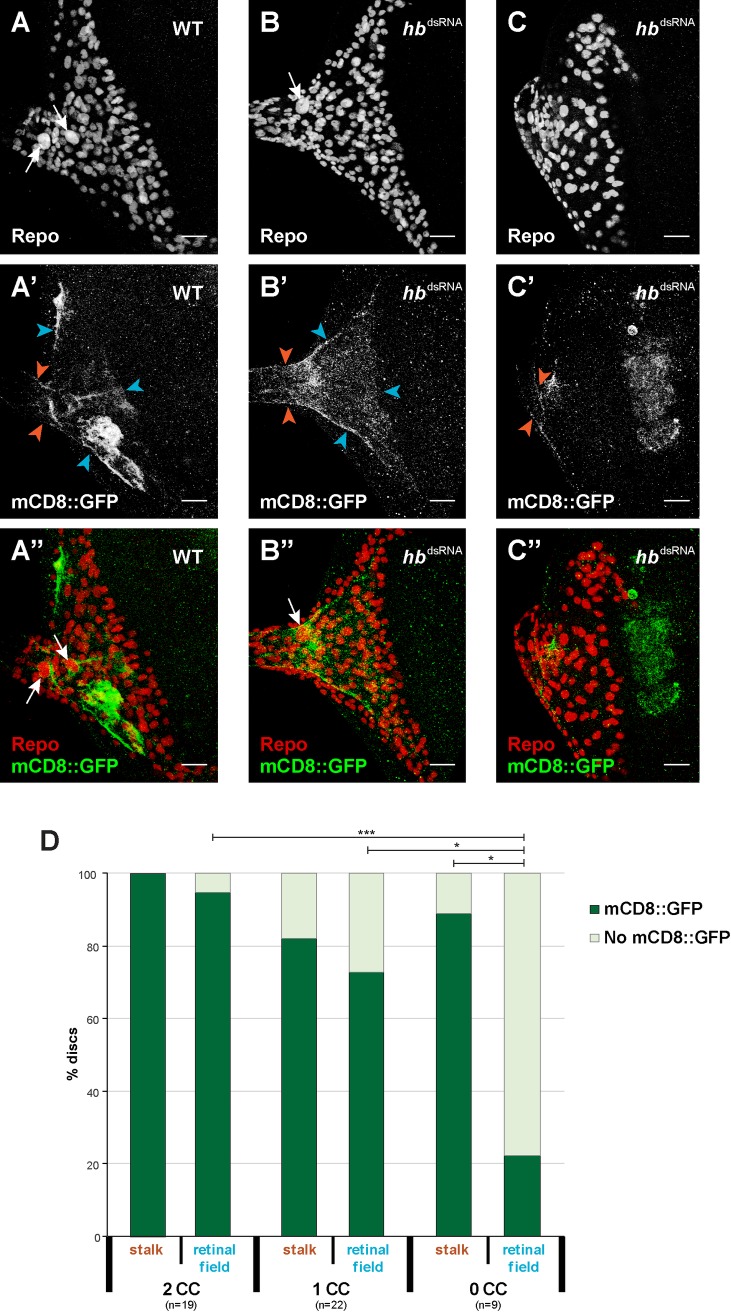
Fig 6. Carpet cell membranes after loss of carpet cells.
(A-C) All glia cells are stained with rabbit α-Repo antibody (red in A”-C”). In control discs, two carpet cells can be identified by their large size (white arrows). After moody driven knock-down of hb expression (B and C) some discs present only one carpet cell nucleus (B, white arrow) and others no carpet cell nucleus (C) (refer to Fig 5 for percentages). (A’-C’) Membranes of carpet cells in late L3 eye-antennal discs are labelled with moody-Gal4 driven UAS-mCD8::GFP expression (green in A”-C”). The presence of these membranes was analyzed in the optic stalk (orange arrowheads) and in the retinal field (determined by the presence of these membranes in the posterior margins of the disc and their extension to the MF (blue arrowheads)). In all pictures, anterior is to the right. Eye disc (ed), optic stalk (os). Scale bar = 20 μm. (D) Quantification of the presence of carpet cell membrane as described in A’-C’. Pearson’s Chi-squared test was performed to determine significance between each pair of condition. *: p-val < 0.05, ***: p-val < 0.0005.

