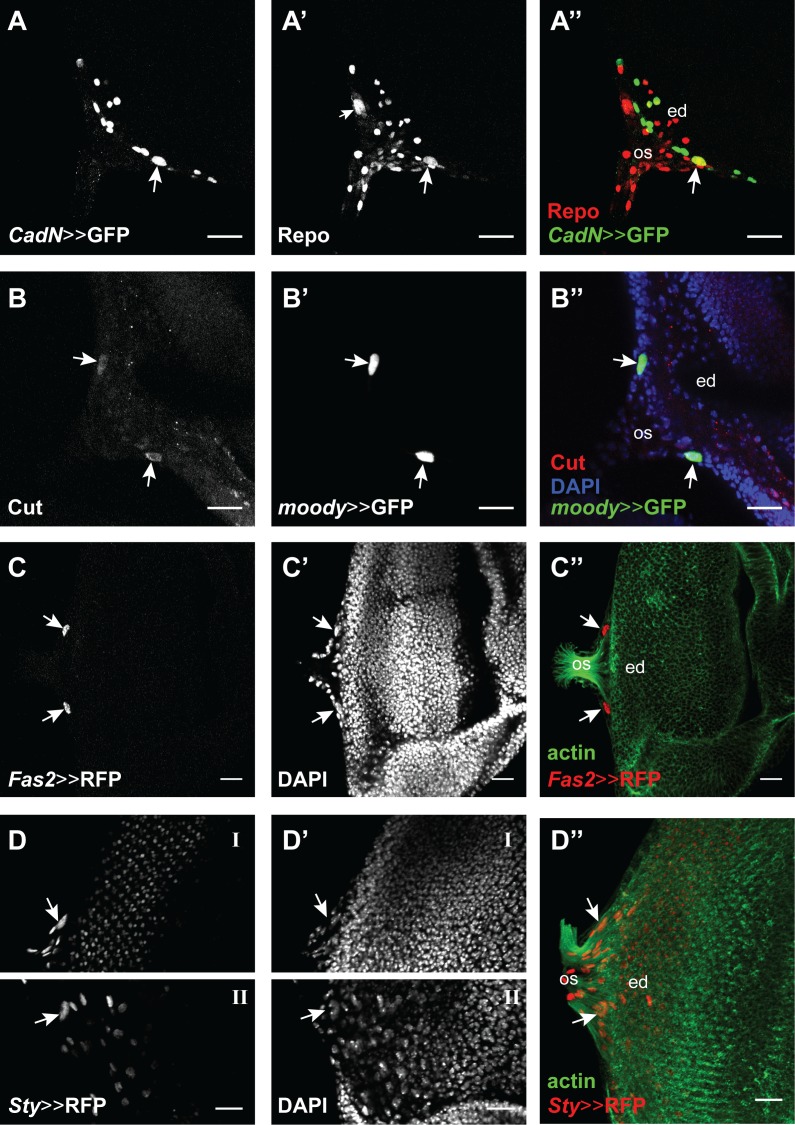
Fig 9. Expression of Hb target genes in the eye-antennal discs.
Four of the tested target genes show expression in carpet cells. Eye disc (ed), optic stalk (os). Scale bar = 20 μm. (A) CadN-Gal4 drives UAS-GFP expression (green in A”) in one of the two carpet cells (white arrow), as well as other cells in the disc, possibly glia cells. (A’ and A”). Glia cells are marked with an antibody against the pan-glial marker Repo (rabbit α-Repo, red) and Repo-positive carpet cell nuclei are recognized by their large size (see also Fig 5D). (B) mouse α-Cut (red in B”) showed a clear signal in the two carpet cells (white arrows). (B’ and B”). Carpet cell nuclei were recognized by the expression of the subperineurial glia marker moody (moody-Gal4 driving UAS-GFP expression, green). DAPI shows the eye-antennal disc surface. (C) Fas2-Gal4 drives UAS-H2B::RFP (red in C”) expression in the two carpet cells (white arrows). (C’ and C”) Carpet cell nuclei are recognized by their large size with DAPI and their location on the posterior edge of the retinal field between the outgoing axons visualized with Phalloidin staining (green). (D) Sty-Gal4 drives UAS-H2B::RFP (red in D”) expression in the two carpet cells (white arrows), as well as in other cells in the disc. Due to folding of the imaged disc, the right (D-I) and left (D-II) carpet cells where not found in the same focal plane. (D’ and D”) Carpet cell nuclei are recognized by their large size with DAPI and their location on the posterior edge of the retinal field between the outgoing axons visualized with Phalloidin staining (green).

