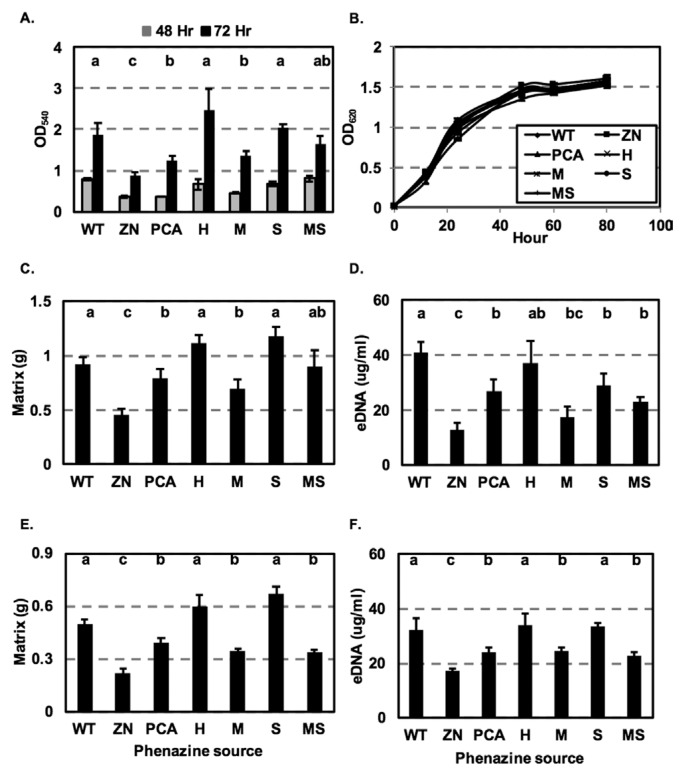
Fig. 4.
Growth curve, biofilm formation and eDNA production by isogenic derivatives of P. chlororaphis 30-84. (A) Biofilm production by cultures grown in 96-well plates containing AB-C for 48 and 72 h. Attached cells with crystal violet staining were quantified at optical density 540 nm. (B) Bacterial cultures were grown in 96-well microtiter polystyrene plates containing AB-C up to 80 h without agitation. Cell density was measured periodically by optical density of 620 nm. (C) Quantification of non-attached floating biofilm matrix by cultures grown in 24-well plates containing AB-C for 72 h at 28°C without agitation. Non-attached floating biofilm matrix was determined by weight. (D) Quantification of extracellular DNA produced by cultures grown in 24-well polystyrene plates containing AB-C for 72 h at 28°C without agitation; extracellular DNA concentration was quantified using a Qubit fluorometer (invitrogen Life Technologies). Quantification of (E) non-attached floating biofilm matrix and (F) extracellular DNA produced by the phenazine non-producing strain 30-84ZN when grown for 72 h in cultures containing supernatants from each of the phenazine-producing strains or 30-84ZN (negative control). The designation on the X axis indicates the source of the supernatants. All data represent the average of 6 biological replicates and error bars indicate the standard error. Values with the same letter do not differ significantly as determined by a Fishers protected Least Significantly Difference (LSD) test (P > 0.05).

