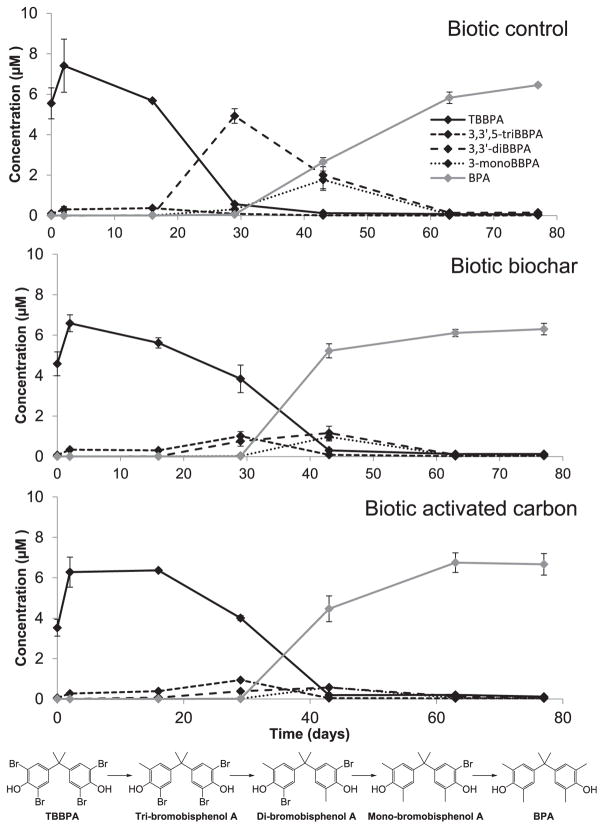
Fig. 1.
TBBPA degradation and formation of BPA in the biotic reactors. Concentration of TBBPA, BPA, and transformation by-products (i.e., 3,3′,5-triBBPA, 3,3′-diBBPA, 3-monoBBPA) in the control reactor, and reactors amended with biochar and activated carbon over time. Error bars represent standard deviation from the mean. TBBPA reductive debromination pathway is shown below the graphs. No loss of TBBPA was observed in the abiotic controls (See Fig. S4).

