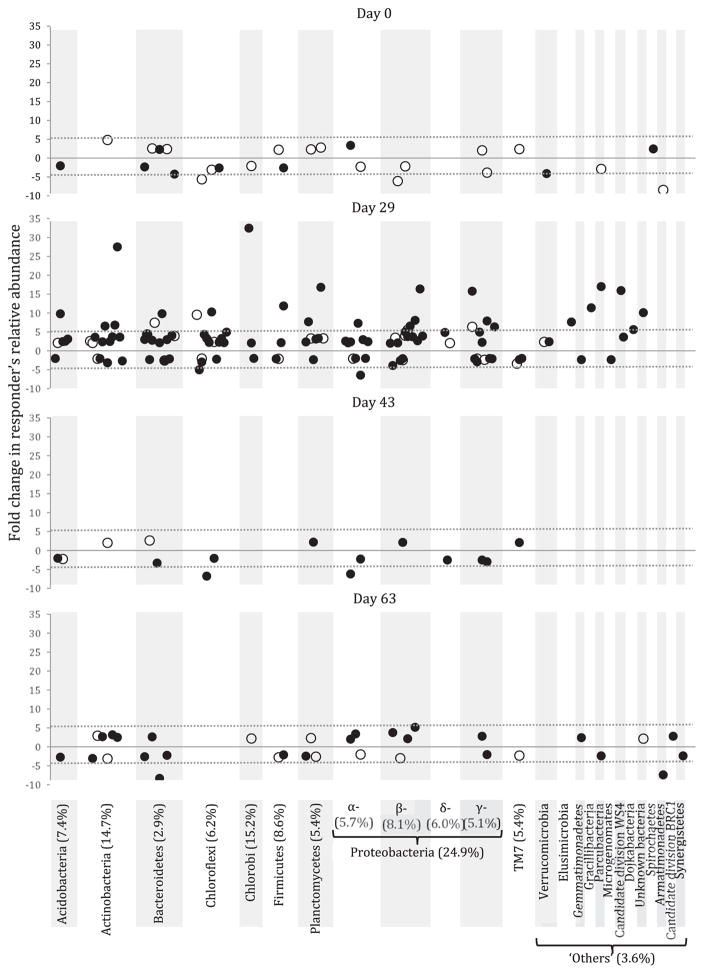
Fig. 3.
Fold change in responding OTUs’ relative abundance between control and amended reactors for each post-amendment sampling date. Responders are defined as OTUs whose relative abundance significantly (p < 0.05) increases or decreases more than twice in the amended reactors relative to the control. Each black and white circle represents a responding OTU detected in the biochar - and activated carbon-amended reactors, respectively. Dash lines on each graph are visual references for a fold change of 5. Phylum-level taxonomic affiliation is indicated at the bottom, and the number of responding OTU in each taxonomic group is indicated between parentheses.

