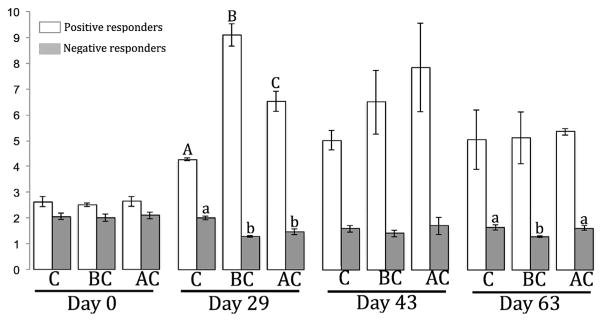
Fig. 4.
Relative abundance of positive and negative responders in each reactor for each sampling day. Error bars represent the standard deviation from the mean. For each sampling day and category of responders, significant differences between treatments (t-test; p < 0.05), when found, are indicated by a different letter (upper case for the positive responders, and lower case for the negative responders). C: control; BC: biochar; AC: activated carbon.

