
Figure 2.
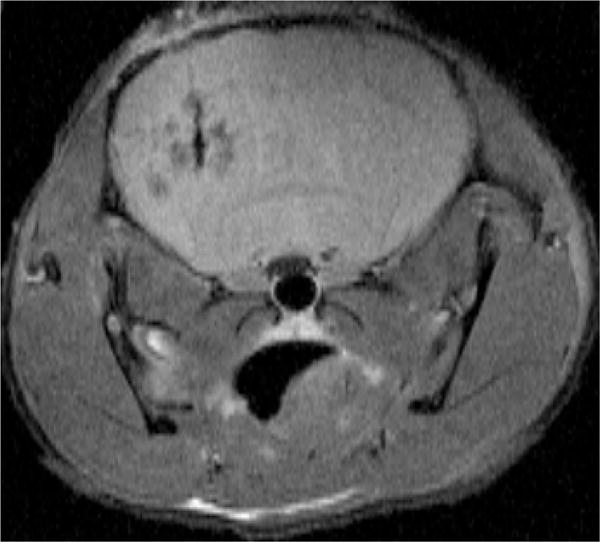
In vivo T2-weighted spin echo coronal image of mouse brain (TE = 15 ms, TR = 1200 ms) showing the site inoculated with the MRI transgene L*H Ft on the left and Lac Z control on the right
Official websites use .gov
A
.gov website belongs to an official
government organization in the United States.
Secure .gov websites use HTTPS
A lock (
) or https:// means you've safely
connected to the .gov website. Share sensitive
information only on official, secure websites.
In vivo T2-weighted spin echo coronal image of mouse brain (TE = 15 ms, TR = 1200 ms) showing the site inoculated with the MRI transgene L*H Ft on the left and Lac Z control on the right