. 2018 Jan 5;7:e32724. doi: 10.7554/eLife.32724

Figure 1. SauCas9 cleaves single-stranded RNA without a PAMmer.

(A) Schematic of Cas9 proteins tested for sgRNA-mediated RNA cleavage. RuvC, RuvC nuclease domain; BH, bridge-helix; REC, recognition domain; HNH, HNH nuclease domain; PLL, phosphate-lock loop; WED, wedge domain; PI, PAM-interacting domain. Adapted from (Nishimasu et al., 2014; 2015; Hirano et al., 2016; Yamada et al., 2017). (B) Representative in vitro cleavage of ssRNA by Cas9-sgRNA RNP complexes of homologs in (A). Radiolabeled pUC target RNA was incubated with Cas9 RNP at 37˚C and time points were taken at 0, 10, 30, and 60 min. Full time course is presented in Figure 1—figure supplement 1B. T1 indicates size markers generated by RNase T1 digestion of ssRNA target. Size in nucleotides is indicated on the left. (C) (Right) In vitro cleavage assay of various RNA substrates (Left). Full time course is presented in Figure 1—figure supplement 3A.

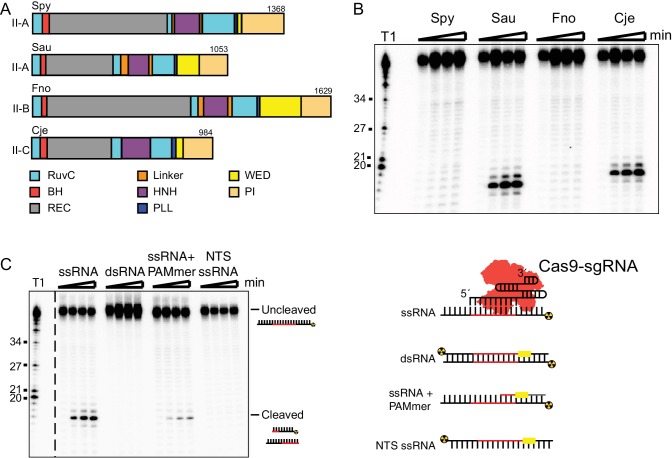
Figure 1.

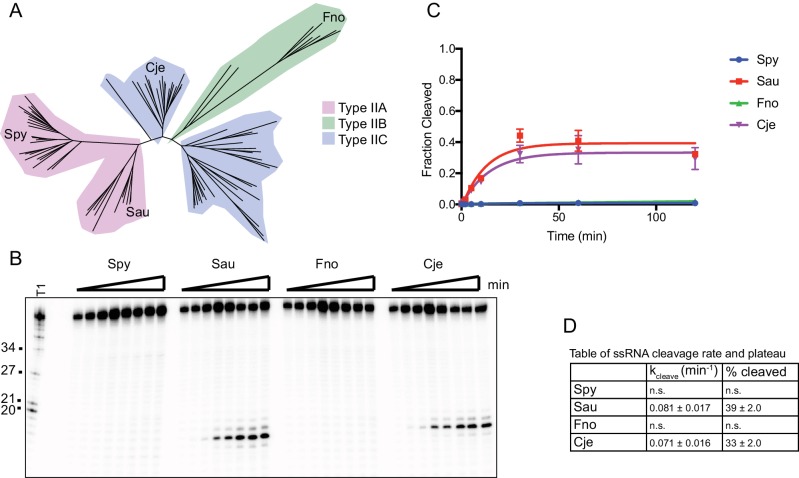
Figure 1—figure supplement 1. RNA is cleaved by SauCas9 and CjeCas9.

Figure 1—figure supplement 1.

(A) Phylogenetic tree of Cas9 homologs assayed for ssRNA cleavage activity. Tree was generated using homologs gathered from (Chylinski et al., 2014). Only homologs tested for activity are highlighted as leaves on the tree. Clades are colored by Cas9 sub-type. (B) Representative in vitro cleavage gel for ssRNA targeting by various Cas9 homologs in (A). Target used for cleavage was the pUC ssRNA. Time points are 0, 1, 2, 5, 10, 30, 60, and 120 min. T1 RNase digest size fragments are given on the left. (C) Quantification of fraction cleaved in (B). Fit was determined in Prism using a single-exponential decay model. Error bars represent the mean ± S.D. (n = 3). (D) Apparent pseudo-first order fit parameters of the data in (C) where ‘% cleaved’ indicates the fraction of substrate cleaved when the reaction plateaus (mean ± S.D.).
Figure 1—figure supplement 1—source data 1. ssRNA cleavage time course for Cas9 homologs.
DOI: 10.7554/eLife.32724.005
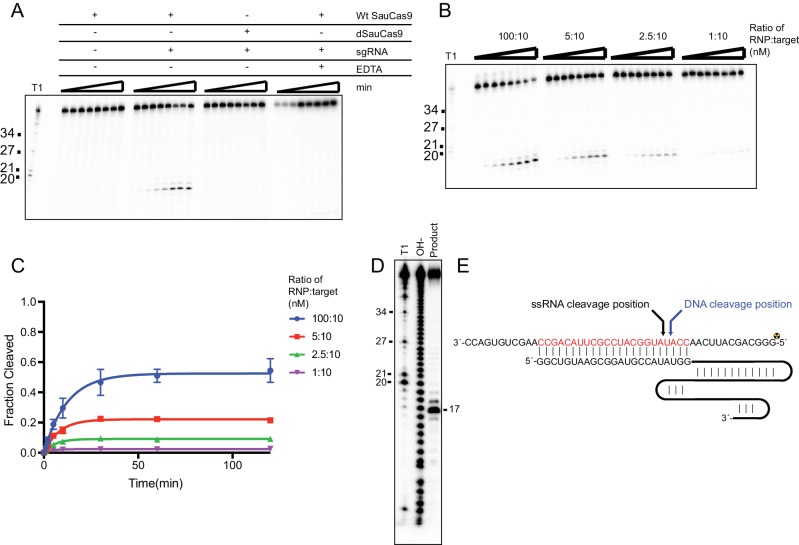
Figure 1—figure supplement 2. ssRNA cleavage is similar to canonical dsDNA cleavage by Cas9.

Figure 1—figure supplement 2.

(A) In vitro SauCas9 cleavage assay of ssRNA. Reactions were incubated with wild-type (Wt SauCas9) or catalytically-inactive dSauCas9 (D10A and N580A) in the presence or absence of sgRNA as indicated above the reactions. EDTA was included at 25 mM where applicable. (B) SauCas9 ssRNA cleavage is single-turnover. SauCas9 RNP was incubated with the RNA target in the various ratios indicated. (A and B) Time points are 0, 1, 2, 5, 10, 30, 60, and 120 min. T1 RNase digest size fragments are given on the left. Target used for cleavage was the pUC ssRNA. (C) Graphical representation of ssRNA fraction cleaved of reactions in (B). Fit was determined in Prism using a single-exponential decay model. Error bars represent the mean ± S.D. (n = 3). (D) Mapping of SauCas9 ssRNA cleavage site. Reaction products from a 2 hr incubation of SauCas9 RNP with the pUC ssRNA target were separated on a 15% denaturing PAGE gel with a hydrolysis and T1 digest ladder to determine exact site of the major cleavage product. (E) Diagram of canonical DNA cleavage position and ssRNA cleavage position as determined in (D).
Figure 1—figure supplement 2—source data 1. Quantification of multi-turnover cleavage.
DOI: 10.7554/eLife.32724.007
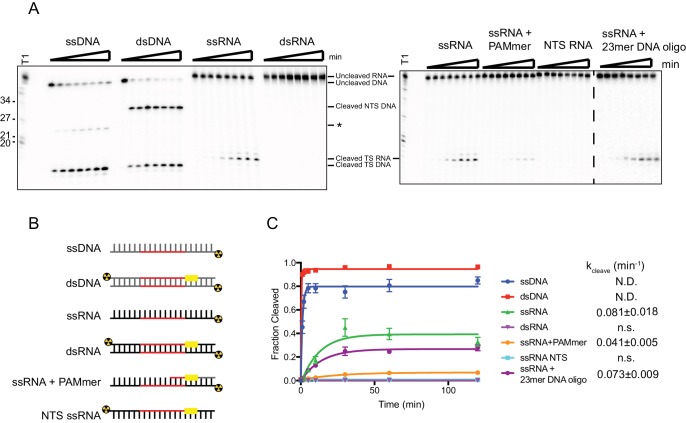
Figure 1—figure supplement 3. SauCas9 cleavage of different nucleic acid substrates.

Figure 1—figure supplement 3.

(A) Representative cleavage assay of nucleic acid substrates diagramed in (B) by SauCas9. Asterisk denotes an off-target cleavage site. Time points are 0, 1, 2, 5, 10, 30, 60, and 120 min. T1 RNase digest size fragments are given on the left. (C) Quantification of results in (A). Fit was determined in Prism using a single-exponential decay model. Error bars represent the mean ± S.D. (n = 3). Apparent pseudo-first order rate constant (kcleave ± S.D.) is given to the right of the substrate legend. N.D. indicates that an accurate rate cannot be determined due to the reaction reaching completion before the second time point. N.s., not significant.
Figure 1—figure supplement 3—source data 1. Quantification of SauCas9 cleavage of nucleic acid substrates.
DOI: 10.7554/eLife.32724.009
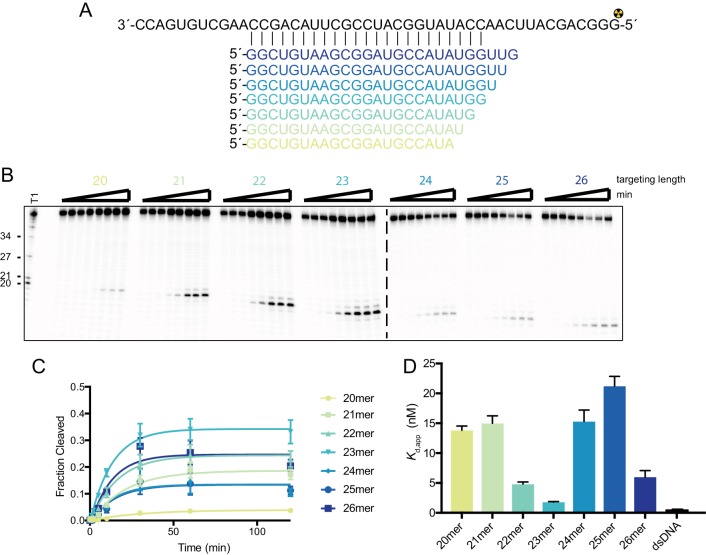
Figure 1—figure supplement 4. SauCas9 prefers a complementary region of 23nt for binding and cleavage.

Figure 1—figure supplement 4.

(A) Diagram of pUC ssRNA target and regions of complementary for the different length sgRNAs. (B) Representative in vitro cleavage assays using sgRNAs with a complementary region to the target of the indicated lengths. Time points are 0, 1, 2, 5, 10, 30, 60, and 120 min. T1 RNase digest size fragments are given on the left. (C) Quantification of cleavage products from reactions in (B). Length of targeting region of the sgRNA given as n-mer. Fit was determined in Prism using a single-exponential decay model. Error bars represent the mean ± S.D. (n = 3). (D) Filter binding data for dSauCas9 and the structured RNA substrates were fit in Prism using a one-site binding model and the apparent dissociation constant (Kd,app) was determined. Bars represent the mean ± S.D. (n = 3).
Figure 1—figure supplement 4—source data 1. Cleavage and binding data for different length guides.
DOI: 10.7554/eLife.32724.011