. 2018 Jan 5;7:e32724. doi: 10.7554/eLife.32724

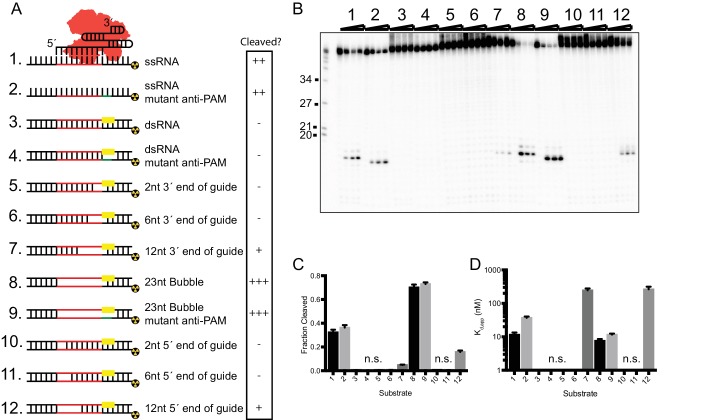
Figure 2. In vitro RNA cleavage is impaired by strong secondary structure.

(A) Schematic representation of structured RNA targets for in vitro cleavage assays. Symbols on right indicate relative level of cleavage activity for each substrate: ‘-”, no cleavage; ‘+”, low cleavage; ‘++”, medium cleavage; ‘+++” high cleavage. (B) Representative cleavage assay of partially-duplexed RNA targets diagrammed in (A). T1 indicates size markers generated by RNase T1 digestion of ssRNA target. Size in nucleotides is indicated on the left. (C and D) Fraction of target cleaved (C) and Kd,app (D) for substrates diagrammed in (A). Fits were determined in Prism using a single-exponential decay and a one-site binding model, respectively. Bars represent mean ± S.D. (n = 3). N.s. denotes no significant cleavage or binding.

Figure 2—source data 1. Quantification of cleavage and binding of structured RNA substrates by SauCas9.
elife-32724-fig2-data1.xlsx (260.2KB, xlsx)
DOI: 10.7554/eLife.32724.015

Figure 2.

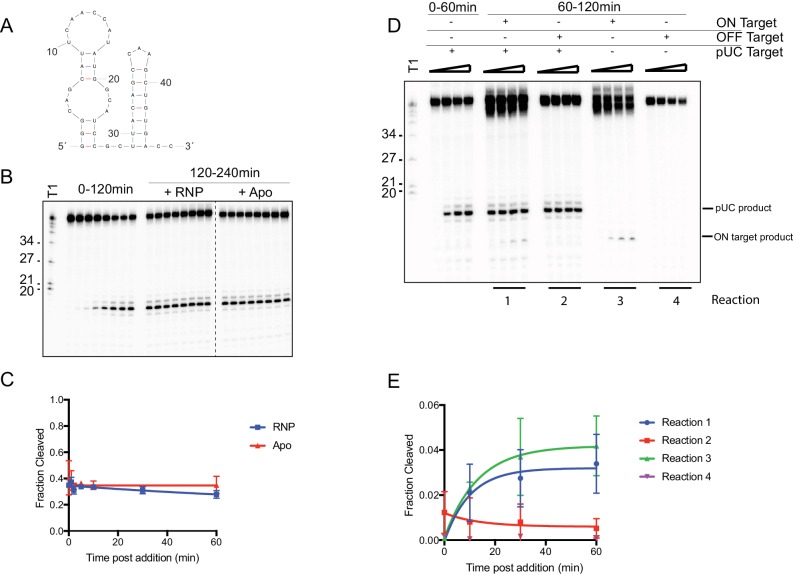
Figure 2—figure supplement 1. RNA cleavage is limited by the RNA target.

Figure 2—figure supplement 1.

(A) Predicted secondary structure of target RNA used in this study. (B) In vitro cleavage assay of ssRNA with SauCas9 was conducted for 2 hr (time points: 0, 1, 2, 5, 10, 30, 60, 120 min). The reaction was split and SauCas9-sgRNA RNP or apo SauCas9 were added. The reaction was further incubated at 37˚C and additional time points at were taken to check for additional cleavage of the target. Time points were taken at 0, 1, 2, 5, 10, 30, 60, and 120 min post-RNP/apo SauCas9 addition. (C) Fit for data in (B) was determined in Prism using a single-exponential decay model. Error bars represent the mean ± S.D. (n = 3). (D) In vitro cleavage assay of two ssRNA targets added sequentially. After 60 min incubation of SauCas9 with the pUC target, another target containing either the same recognition sequence (ON target – reaction 1) or an unrelated sequence (OFF target – reaction 2) were added to the reaction. Cleavage was assayed for an additional 60 min (time points: 0, 10, 30, 60 min). Reactions containing only the second target (Reactions 3 and 4) were conducted with SauCas9 RNP that was incubated for 60 min at 37˚C prior to addition to the cleavage reaction. (E) Quantification of cleavage of second target in (D) for time points after addition. Fit was determined in Prism using a single-exponential decay model. Error bars represent the mean ± S.D. (n = 3).
Figure 2—figure supplement 1—source data 1. Quantification of ssRNA after additional protein and target spike-in.
DOI: 10.7554/eLife.32724.014