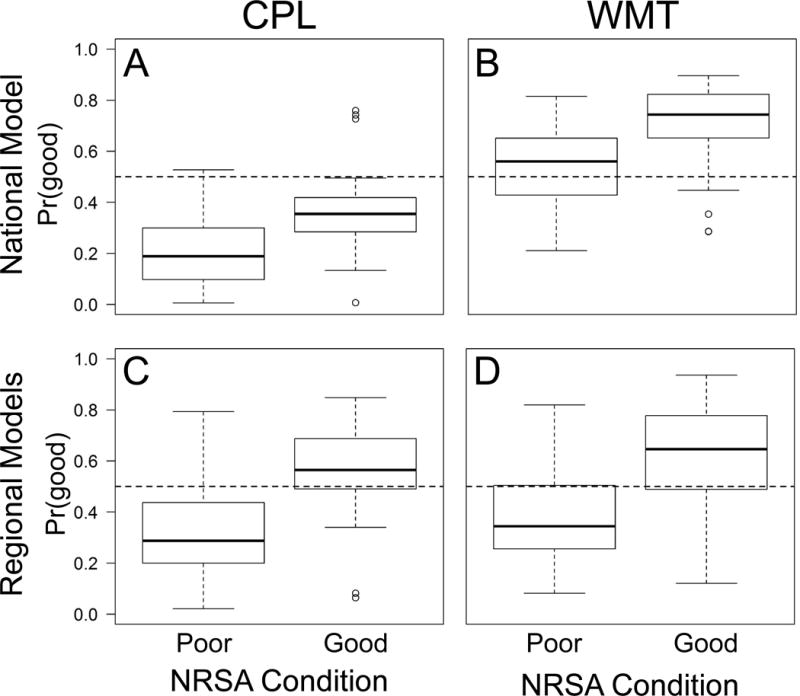
Figure 3.

Boxplots of predicted probabilities of good biological condition [Pr(good)] for a single, national model (A-B) and for region-specific models (C-D) versus observed NRSA condition. Horizontal dashed lines represent Pr = 0.5. Regional abbreviations: CPL = Coastal Plains; WMT = Western Mountains. NRSA Condition = the condition assigned by the National Rivers and Streams Assessment and used as the response variable in our models.
