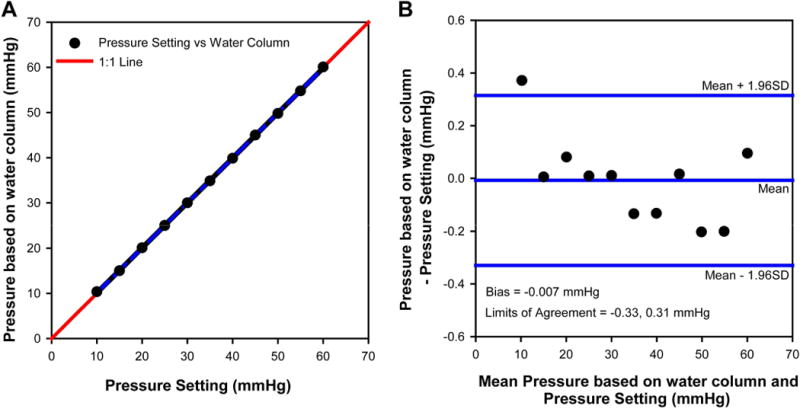
Figure 1.

(A) Correspondence between pressure setting and rise of water column converted to mmHg and comparison to the 1:1 line. (B) Bland-Altman plot for the agreement between pressure setting and water column rise, illustrating the bias and 95% limits of agreement.
