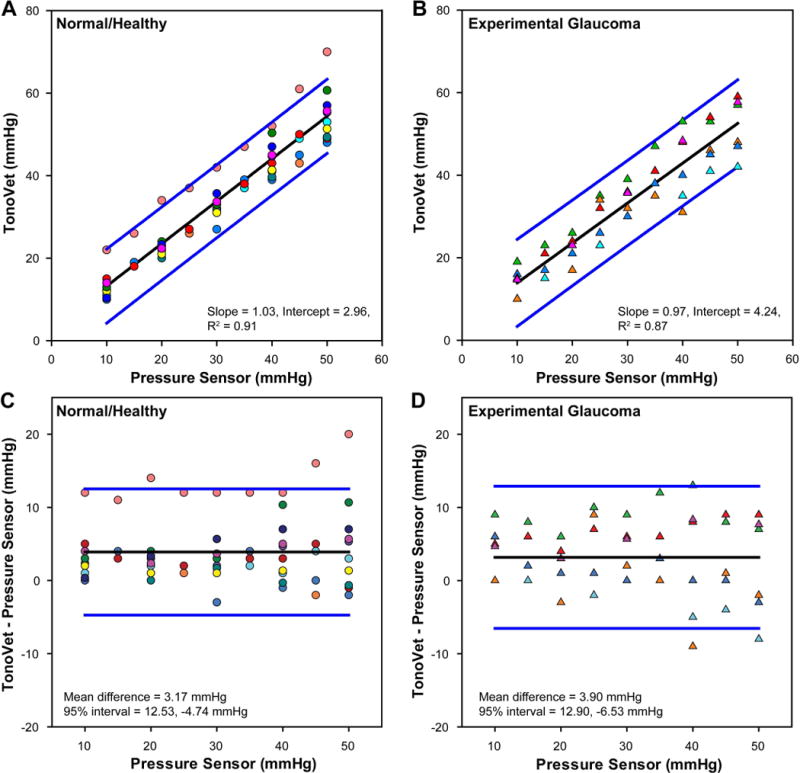
Figure 2.

(A & B) The relationship between TonoVet IOP and intracameral pressure in normal healthy and experimental glaucoma eyes. (C & D) Difference in tonometer IOP measures from that of the pressure transducer. Healthy eyes are represented by circles and experimental glaucoma with triangles. Each animal is represented by a unique color.
