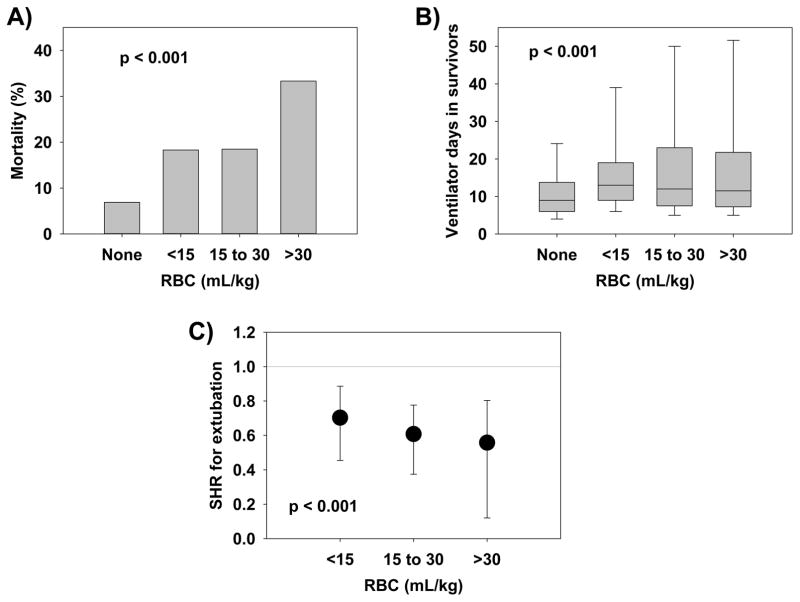
Figure 2.
Dose response curves showing the associations between increasing amounts of red blood cells (RBC) and (A) mortality, (B) ventilator days among survivors, and (C) subdistribution hazard ratio (SHR) from competing risk regression reflecting probability of extubation. RBC doses are expressed as milliliters per kilogram (mL/kg) of actual body weight.

