Figure 5.

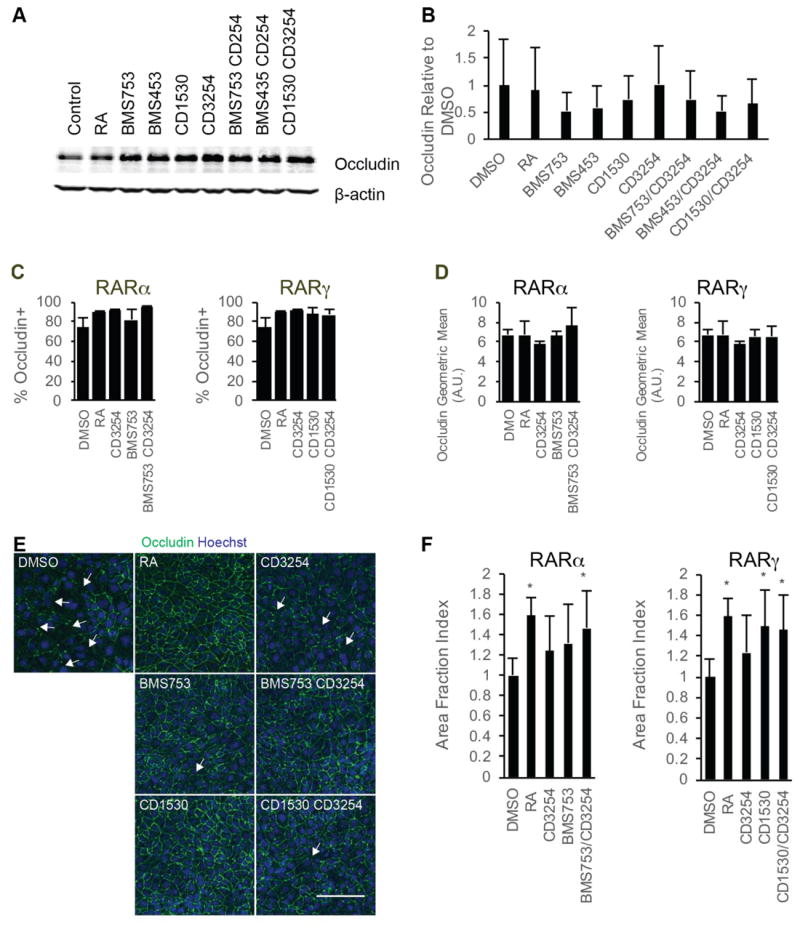
Changes in tight junction proteins following RAR/RXRα coactivation. A) Occludin- and β-actin signals from representative Western blots of D8 cell lysates following D6-D8 treatment with the indicated compounds from three independent differentiations; n = 3. The β-actin signal is additionally shown as a control in Figure 3B. B) Quantification of occludin protein levels over three independent differentiations via densitometry of Western blots. Error bar represents standard error of the mean. ANOVA test failed. C) Percentage of occludin+ cells as quantified by flow cytometry in D10 iPSC-derived BMECs following D6-D9 treatment with the indicated RA-signaling associated nuclear hormone receptor agonists; n = 3. Error bars represent standard error of the mean. Right panel: comparison for RARα agonism to coRARα/RXRα and controls. Left panel: comparison for RARγ agonism to coRARγ/RXRα and controls. ANOVA tests failed. D) Geometric mean of occludin fluorescence levels in occludin+ cells as measured by flow cytometry in D10 iPSC-derived BMECs following D6-D9 treatment with the indicated RA-signaling associated nuclear hormone receptor agonists; n = 3. Error bars represent standard error of the mean. Right panel comparison for RARα agonism to coRARα/RXRα and controls. Left panel comparison for RARγ agonism to coRARγ/RXRα and controls. ANOVA failed. E) Representative occludin immunocytochemistry images for iPSC-derived BMECs at D10 following D6-D9 treatment with the indicated RA-signaling associated nuclear hormone receptor agonists; n = 3. occludin is shown in green and Hoechst counterstain is indicated in blue. Scale bar represents 100 μm. F) Area fraction index quantification of occludin immunostaining images. Error bars represent standard deviation. N = 11 independent fields over three differentiations with at least three independent fields per differentiation. Right panel comparison for RARα agonism to coRARα/RXRα and controls. Left panel comparison for RARγ agonism to coRARγ/RXRα and controls. ANOVA followed by Dunnett’s test. * p < 0.05 vs. DMSO vehicle control.
