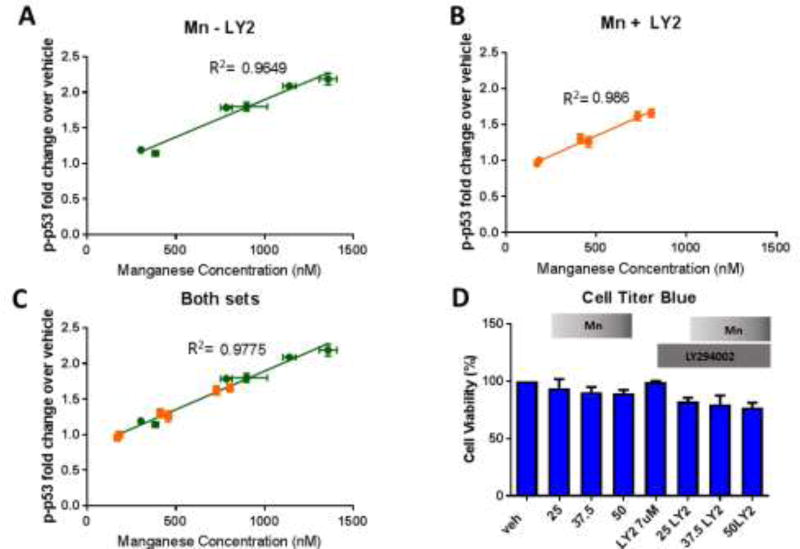
Figure 7. LY294002 inhibits p-p53 activity in STHdh cells by reducing intracellular Mn.
A–C) Linear regression plots for Mn (X) vs p-p53 (Y) across 25µM, 37.5µM, or 50µM Mn exposures with or without LY2 for 24 hours. Mn (A), Mn+LY294002 (B), and Mn combined with Mn+LY2 (C) are plotted separately (n=2 with 5 replicate wells per condition, error bars are SD for each set of 5 replicate wells). R2 values are shown next to each line. ANCOVA: R2=0.98, p=0.218, df=2, F=1.98. D) Cell Titer Blue cell viability assay after 25µM, 37.5µM, or 50µM Mn exposure for 24 hours, with and without LY294002. Error bars= SEM.

