Figure 5.
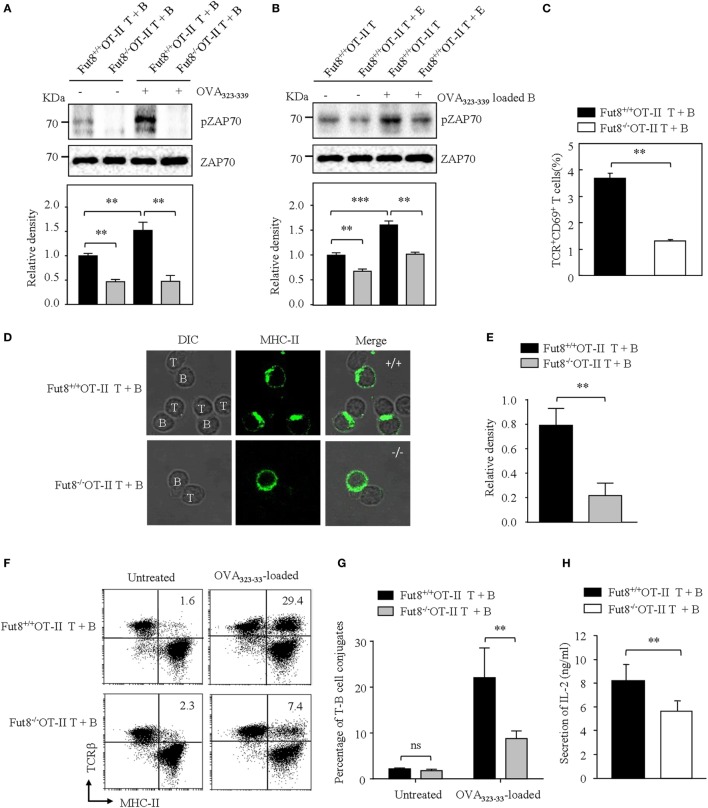
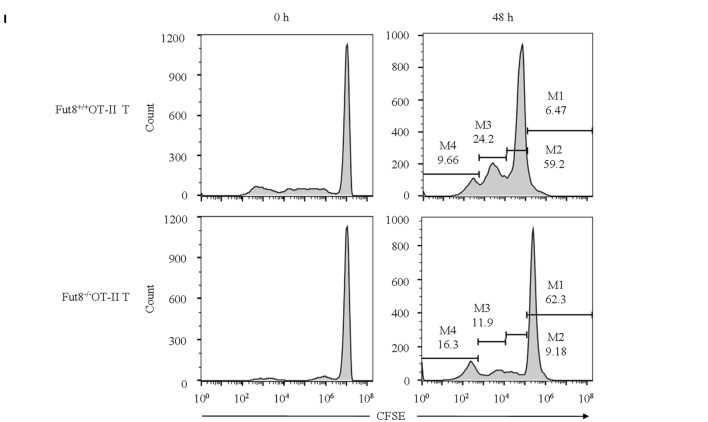
Lack of core fucosulation reduced interaction ability between T cell receptor (TCR) and pMHC-II and impaired the signaling via TCR. (A) ZAP70 phosphorylation of Fut8+/+OT-II T–B cells. (T) B cell conjugate formation was initiated by centrifuging together CD4+ T cells with or without 1 µg/mL OVA323–339-loaded B cells. The blots were probed by anti-pZAP70 Ab and anti-ZAP70 Ab. Data are representative of three independent experiments. Densitometric analysis of the bands of pZAP70 normalized against ZAP70. Data are shown as the mean ± SD (**p < 0.01). (B) ZAP70 phosphorylation of Fut8+/+OT-II CD4+ T cells with or without fucosidase treatment. Purified CD4+ T cells were treated with or without 100 mU Bovine Kidney Fucosidase, and then coincubated with 1 µg/mL OVA323–339 loaded Fut8+/+OT-II B cells for 30 min. The blots were probed by anti-pZAP70 Ab and anti-ZAP70 Ab. Data are representative of three independent experiments. Densitometric analysis of the bands of pZAP70 normalized against ZAP70. Data are shown as the mean ± SD (**p < 0.01; ***p < 0.001). (C) Compare of activation of Fut8+/+OT-II T + B cells and Fut8−/−OT-II T + B cells. CD4+ T cells were conjugated with OVA323–339 loaded B cell. After 30 min, the T–B cells were fixed and stained with anti-TCRβ and anti-CD69 Abs. Data are shown as mean values ± SD (**p < 0.01). (D,E) Distribution of MHC on the T and B cells. The T–B cells were fixed, permeabilized, and stained with Abs to MHC-II (green). Data are from three separate experiments. The ratio of MHC II intensity at the T–B cell conjugate site relative to non-conjugate areas. Data are shown as the mean values ± SD (**p < 0.01). (F) FACS analysis of the conjugates between B cells and CD4+ T cells. B cells (OVA323–339-loaded or not loaded) were labeled with anti-MHC-II (FITC) and CD4+ T cells were labeled with anti-TCRβ (PE-Cy5). T and B cells were quickly mixed and conjugated by a brief centrifugation step. They were then incubated at 37°C for 30 min. A representative staining profile with anti-MHC-II and anti-TCRβ mAb is shown. The conjugate cells are double positive (MHC-II+TCRβ+) cells. (G) Percentage of T–B cell conjugates (both MHC-II and TCRβ positive cells) was calculated. Data are reported as the mean ± SD (**p < 0.01) in four independent experiments. (H) The secrition of IL-2 was downregulated in the culture media of Fut8−/−OT-II T–B cells. OD values were measured at 492 nm using a microplate reader. Data are reported as the mean ± SD (**p < 0.01) in three independent experiments. (I) Proliferation of Fut8+/+OT-II CD4+ T cells with OVA323–339 loaded Fut8+/+OT-II B cells. Fut8+/+OT-II CD4+ T cells were purified and labeled with carboxyfluorescein diacetatesuccinimidyl ester (CFSE). Fut8+/+OT-II CD4+ T cells were cocultivated with 1 µg/mL OVA323–339 loaded Fut8+/+OT-II B cells for 48 h, the divided cells were analyzed by FACS. One representative experiment is shown. M1–M4 indicates daughter cell populations which have subsequently lost half of their CFSE signal.


