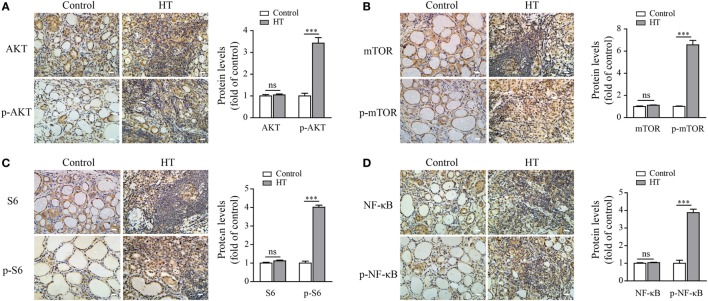
Figure 7.
AKT, p-AKT, mTOR, p-mTOR, S6, p-S6, NF-κB p65, and p-NF-κB p65 expression levels in Hashimoto’s thyroiditis (HT) patient thyroid glands. Representative results from HT patients (n = 10) and control tissues (n = 5) by immunohistochemistry (IHC) staining for AKT and p-AKT (A), mTOR and p-mTOR (B), S6 and p-S6 (C), and NF-κB and p-NF-κB (D) are shown (scale bars, 50 µm). The brown regions represent positive expression. The slides were analyzed under a 400× microscope equipped with a camera. The IHC quantification results from all samples are shown in the right panel. Significant differences and P values are calculated with the Mann–Whitney U test. ns, not significant. ***P < 0.001 vs. controls.

