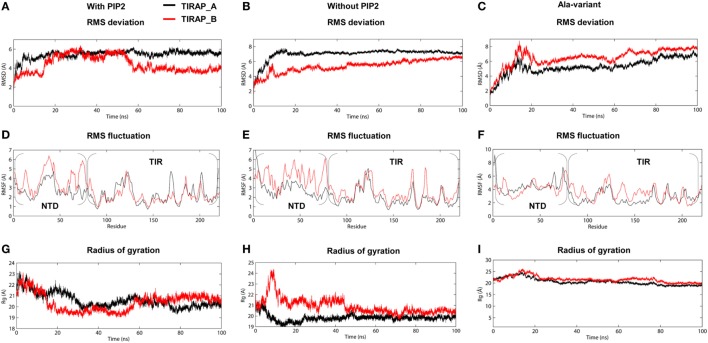
Figure 3.
Stability parameters of toll/interleukin 1 receptor domain-containing adaptor protein (TIRAP) as a function of simulation time. (A–C) Root mean square deviation; (D–F) root mean square fluctuation; and (G–I) radius of gyration. The left and center columns contain stability parameters for phosphatidylinositol 4,5-bisphosphate (PIP2)-bound and unbound TIRAPs, respectively, while the right column contains stability parameters for a mutant TIRAP (K15 → A, K16 → A, K31 → A, and K32 → A). Also, note that each plot shows parameters for chain (A) (black) and chain (B) (red).

