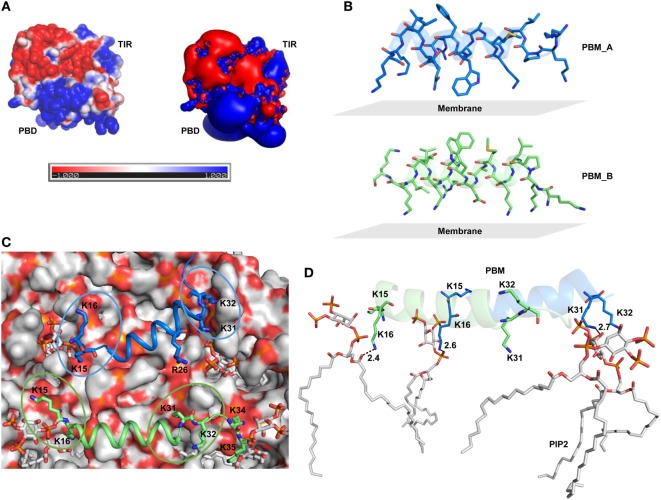
Figure 5.
Surface electrostatics of toll/interleukin 1 receptor domain-containing adaptor protein (TIRAP) and the location of phosphatidylinositol (PI) 4,5-bisphosphate (PIP2) on the membrane surface. (A) Two different representations of electrostatic potential over TIRAP. The left image shows the positive (blue), negative (red), and neutral (white) surfaces of TIRAP, while the right image represents an electrostatic isosurface, showing only the surface distribution of the most positively and negatively charged residues on TIRAP’s surface. (B) Orientation of the PI-binding motif (PBM) side chains with respect to the membrane surface in the final snapshot after 100 ns of molecular dynamics (MD) simulation. (C) Top view of the membrane surface showing the position of PIP2 and PI-binding residues of TIRAP. (D) Intermolecular interaction between dimeric PBM and four PIP2 molecules at the end of 100 ns of MD simulation. Dashed lines represent hydrogen bonds, and digits indicate distances in angstrom units.

