
Figure 2.
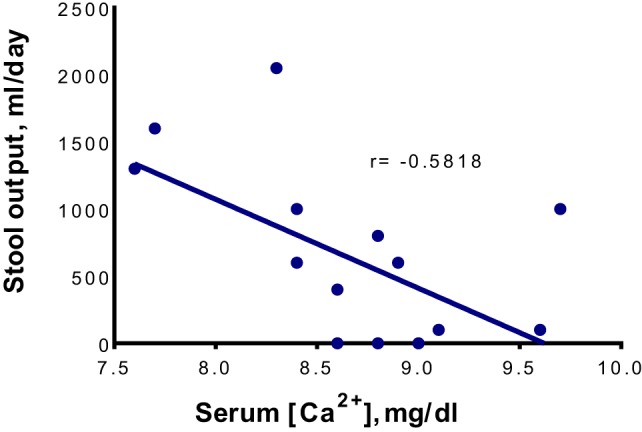
The correlation between serum Ca2+ concentrations ([Ca2+]) and daily stool outputs. The total serum [Ca2+] is shown. The linear regression was performed using Microsoft Excel 2016 for Windows, while the statistical analysis was performed using GraphPad Prism version 6.07 for Windows (GraphPad Software, San Diego, CA, USA). The fluctuation in stool output is correlated significantly with the change in total (r = −0.5818, P = 0.0181) and ionized (r = −0.8396, P = 0.0365, data not shown) serum [Ca2+] in a negative manner.