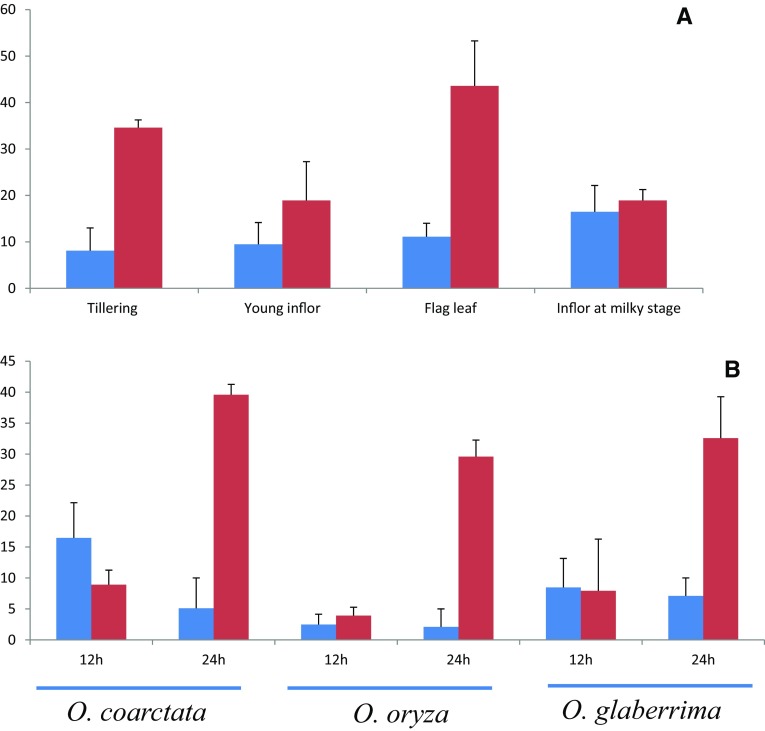
Fig. 11.
Normalized fold change (indicated by vertical value) value of OsDREB2A transcripts expression as revealed by Q-PCR analysis. Top panel indicates tissue-specific expression under salinity stress (EC of ~ 10 dS m−1) of O. glaberrima. Bottom panel indicates in three different species of Oryza in 12 and 24 h salt treatment. a O. coarctata (450 mM). b O. staiva (200 mM) and c O. glaberrima (200 mM). Values are the means ± standard errors (n = 3). Different letters above the columns indicate significant difference at P < 0 0.05. The blue bar indicates control treatment and red bar indicates salinity treatment in both the panel

