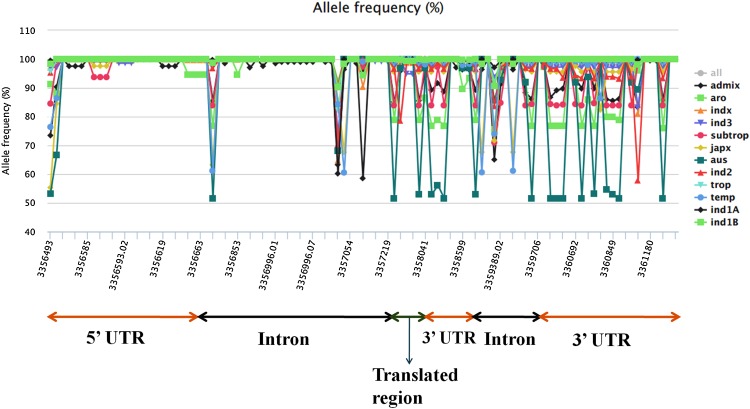
Fig. 3.
Allele frequency for all SNP and indel positions in the queried region with reference to O. sativa japonica Nipponbare. X-axis represents genomic coordinates and Y-axis represents the allele frequency in percentage. The corresponding 5′ and 3′ UTRs, translated region and intron regions are marked

