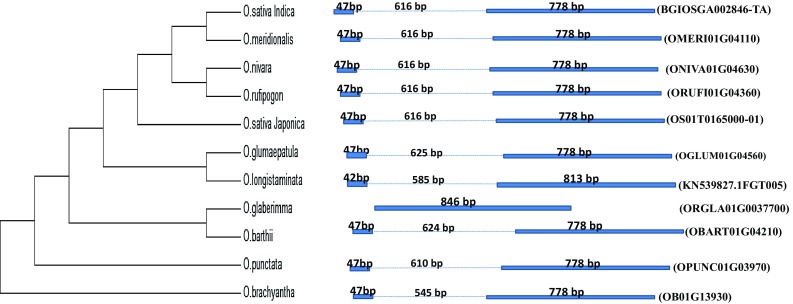
Fig. 9.

Intron–exon architecture analysis of DREB2A gene sequences of Oryza species using the PIECE webtool. The species are shown in the form of a cladogram and the respective intron exon structures are shown in the right. The solid blue bars indicate exon while the dotted lines indicate introns. The length of each intron and exon are indicated above the respective regions. The gene name for each species is indicated with first bracket
