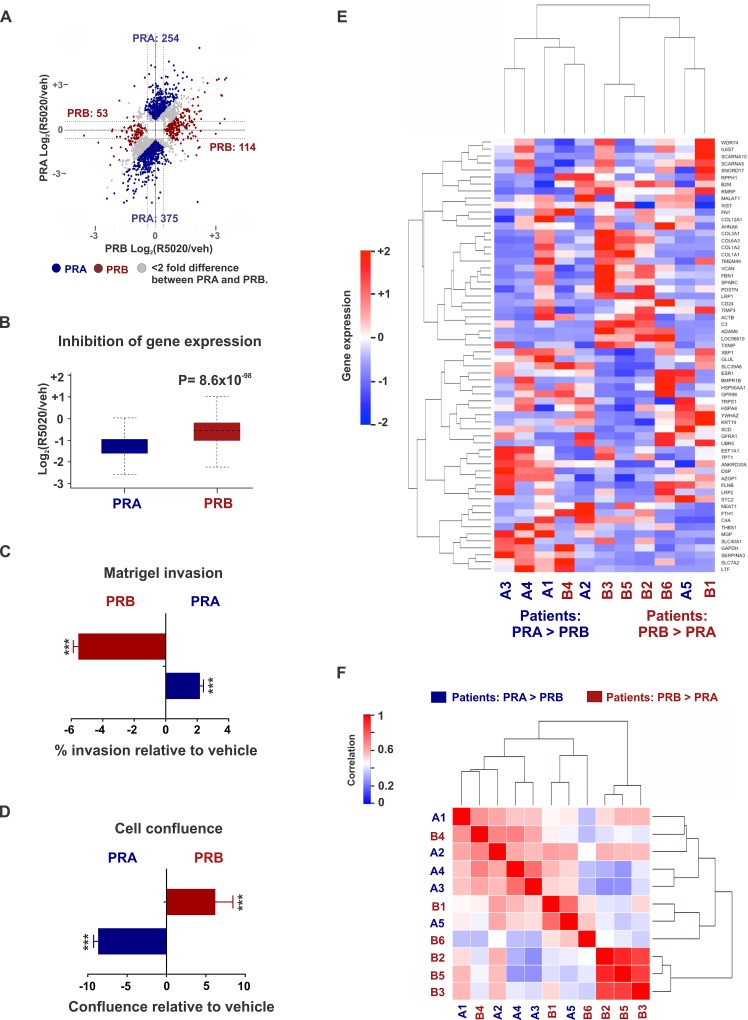
Figure 2. Differential gene expression in patient tumors expressing disproportionate levels of PRA and PRB.
A. Dot plots represent PRA and PRB-regulated genes in T47D cells treated with 10 nM R5020 for twelve hours. PRA is a stronger inducer (or repressor) of gene expression than PRB for the genes represented by blue dots. Conversely, PRB is a stronger inducer (or repressor) of gene expression than PRA for the genes represented by red dots. B. Box plots depict ensemble of magnitude of inhibition of gene expression by PRA or PRB. Dot plots and box plots represent union of PRA and PRB-regulated genes. C., D. Changes in C. matrigel invasion and D. cell confluence of ER+/PRA+ and ER+/PRB+ T47D cells in response to treatments with 10 nM R5020. *** denotes P-value < 10-3. E., F. Heatmaps display E. gene expression and F. sample-sample correlation in five patient tumors expression higher PRA versus PRB and six tumors with higher expression of PRB versus PRA. High correlation (i.e., correlation coefficient 1) between any two samples is displayed in red and low correlation (i.e., correlation coefficient 0) is displayed in blue. Data for nine out of 11 tumors was obtained from Rojas et al [44]. Data for two other unpublished tumors (tumors B3 and B5) used in this study was kindly provided by Dr. Claudia Lanari and Dr. Martin Abba.

