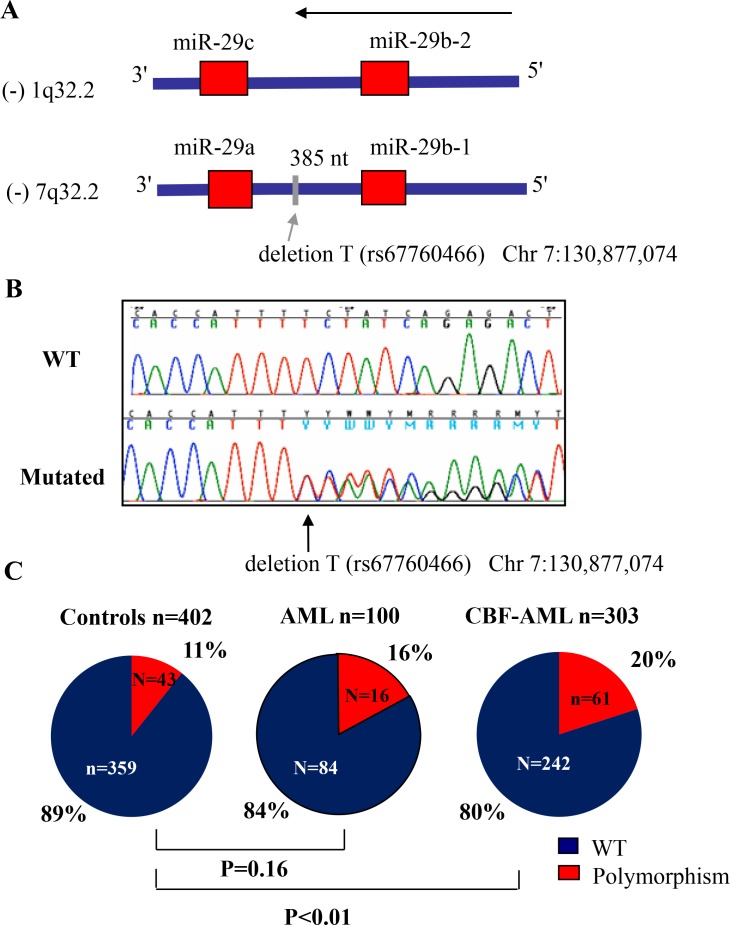
Figure 1. Frequency of thymidine (T) base deletion (rs67760466) in acute myeloid leukemia (AML).
(A) Diagram showing both miR-29 clusters and the location of the T base deletion. (B) Chromatograms showing a wild type (WT) and a polymorphism case. (C) Frequency of the polymorphism (rs67760466) in AML patients and in controls. P values were obtained using the Fisher's exact test. Patient characteristics are detailed in Tables 1 and 2.

