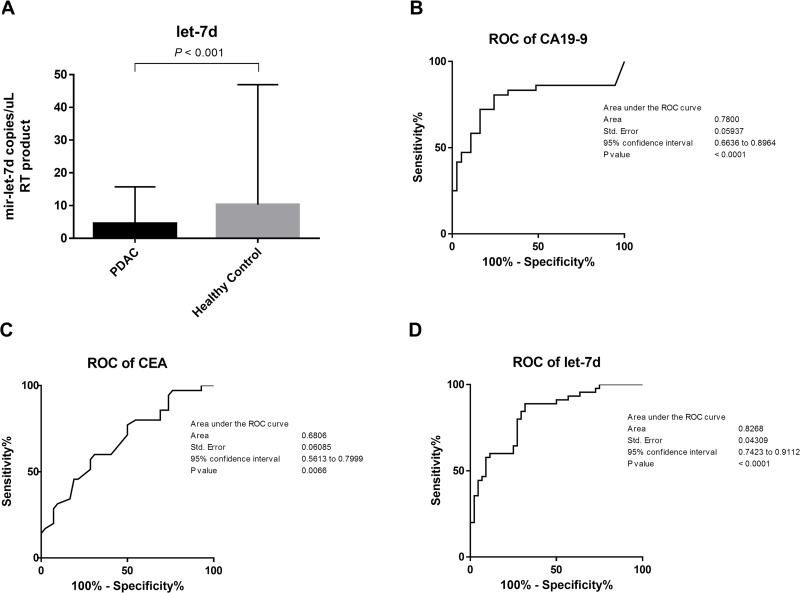
Figure 3. Differentiation between PDAC patients and healthy controls using serum miRNAs.
(A) The levels of CA 19–9 and CEA in serum were higher in PDAC patients compared to controls (271.3 vs. 10.5 U/mL, P < 0.0001 and 3.1 vs. 2.0 ng/mL, P = 0.006, respectively). Serum mir-let-7d expression was lower in PDAC patients compared to controls (4.5 vs. 10.3 copies/μL, P < 0.001). (B–D) ROC analysis demonstrated that these three markers could discriminate between PDAC patients and controls with an AUC of 0.68 for CEA (95% CI: 0.56 to 0.79), 0.78 for CA 19-9 (95% CI: 0.66 to 0.89), and 0.83 for mir-let-7d (95% CI: 0.74 to 0.91).

